Dark Current
-
Posts
305 -
Joined
-
Last visited
-
Days Won
1
Content Type
Profiles
Forums
Events
Store
Articles
Patch Notes
Everything posted by Dark Current
-

DEFCON II: AFTERMATH — Do Controllers Still Outscale Defenders?
Dark Current replied to Dark Current's topic in Archetypes
Project: EXETER - Arsenal / TA / Mace Controller Build Deep-Dive and Solo Strategy video... -
DEFCON II: AFTERMATH — Do Controllers Still Outscale Defenders?
Dark Current replied to Dark Current's topic in Archetypes
Red Riding Hood - TA / Fire / Fire Defender Build Deep-Dive and Solo Strategy video... -
DEFCON II: AFTERMATH — Do Controllers Still Outscale Defenders?
Dark Current replied to Dark Current's topic in Archetypes
DEFENDER Red Riding Hood Trick Arrow / Fire Blast / Fire Mastery Mids Build: Red Riding Hood - Defender (Trick Arrow).mbd Watch her Build and Solo Strategy Video... SOON CONTROLLER Project: E.X.E.T.E.R. Arsenal Control / Trick Arrow / Mace Mastery Mids Build: Project EXETER - Controller (Arsenal Control - Trick Arrow).mbd Watch his Build and Solo Strategy Video... SOON
-
DEFCON II: AFTERMATH — Do Controllers Still Outscale Defenders?
Dark Current replied to Dark Current's topic in Archetypes
Time of the Grand Finale of DEFON: Aftermath... TRICK ARROW!!! Prepare for the match up by watching my Deep Dive into what makes this set Twang... Then, pick your favorite DEFCON for this final matchup! Is it the Vengeful Huntress or the Modular Weapons Platform???
-
DEFCON II: AFTERMATH — Do Controllers Still Outscale Defenders?
Dark Current replied to Dark Current's topic in Archetypes
Reserving this for Storm Summoning stats and graphs from final analysis. -
DEFCON II: AFTERMATH — Do Controllers Still Outscale Defenders?
Dark Current replied to Dark Current's topic in Archetypes
It was an EF5! -
DEFCON II: AFTERMATH — Do Controllers Still Outscale Defenders?
Dark Current replied to Dark Current's topic in Archetypes
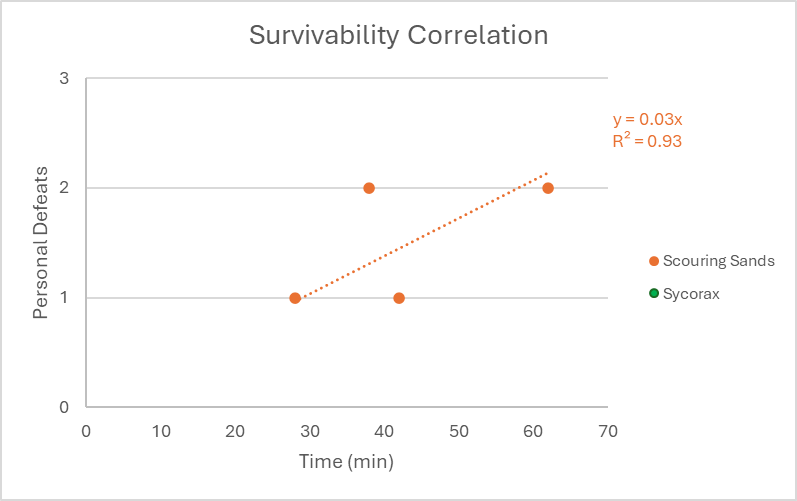
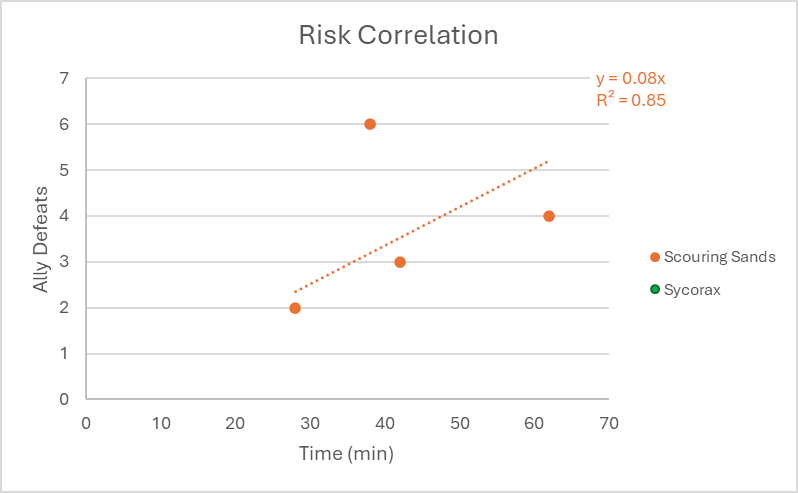
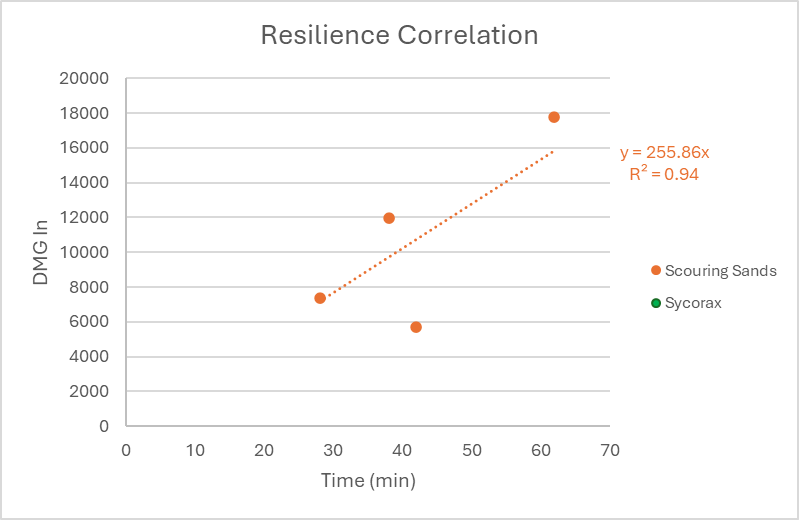
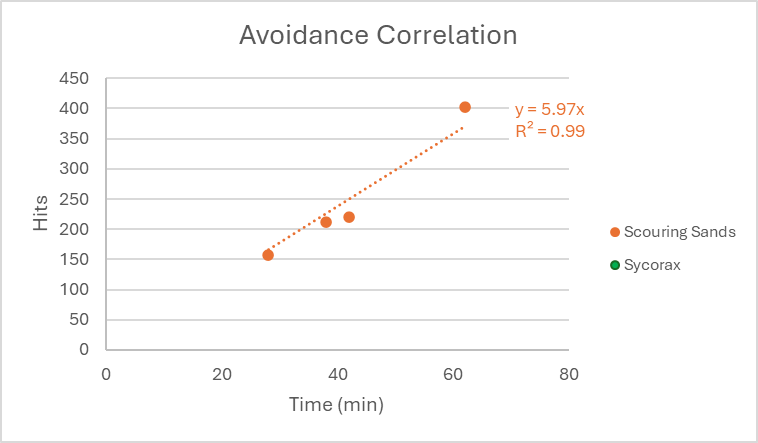
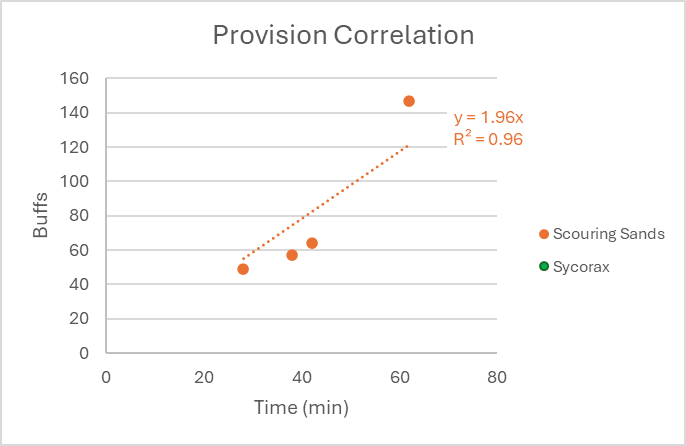
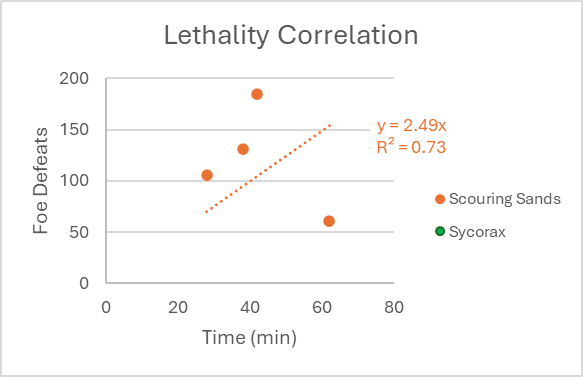
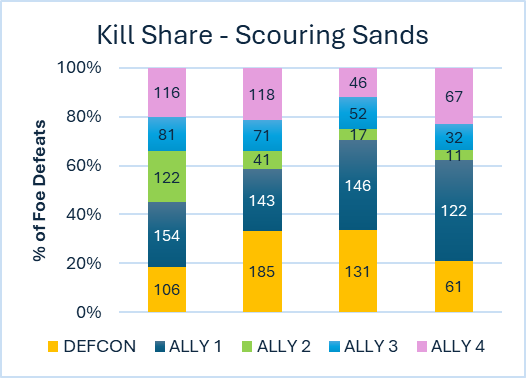
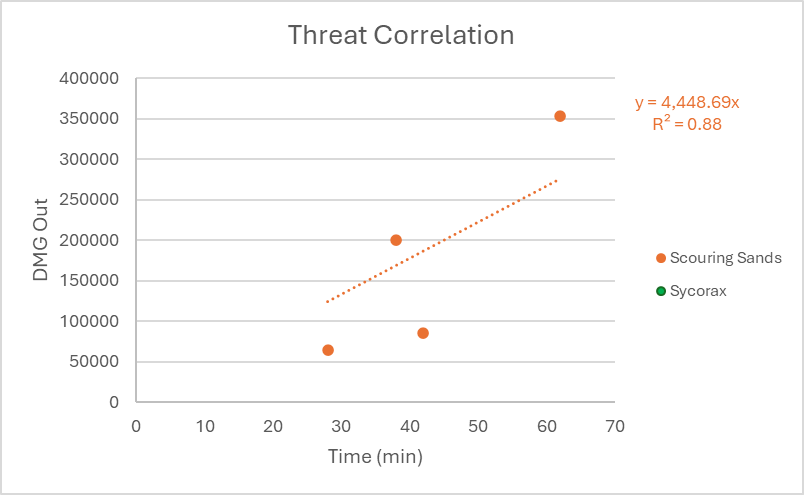
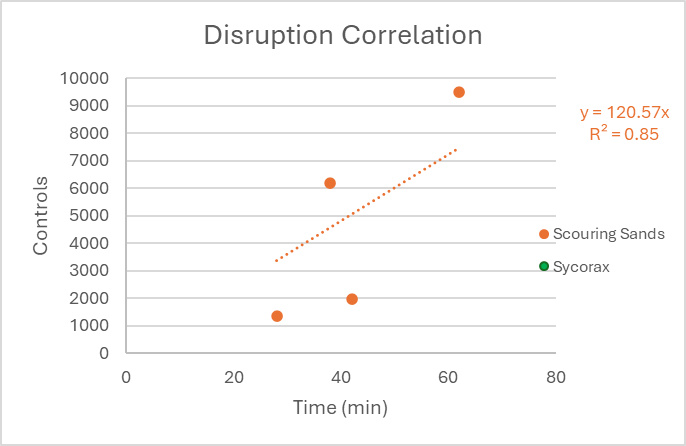
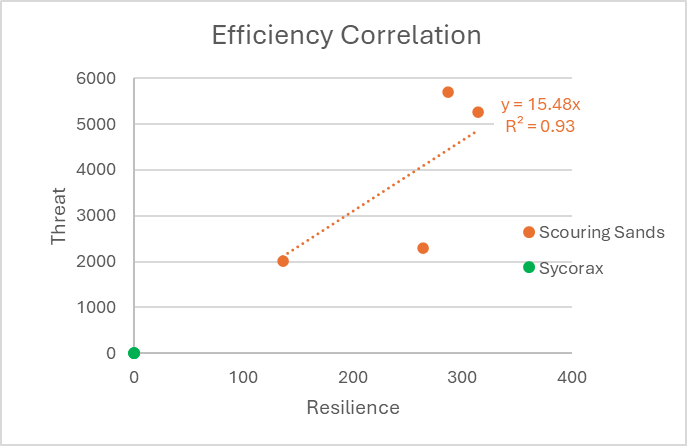
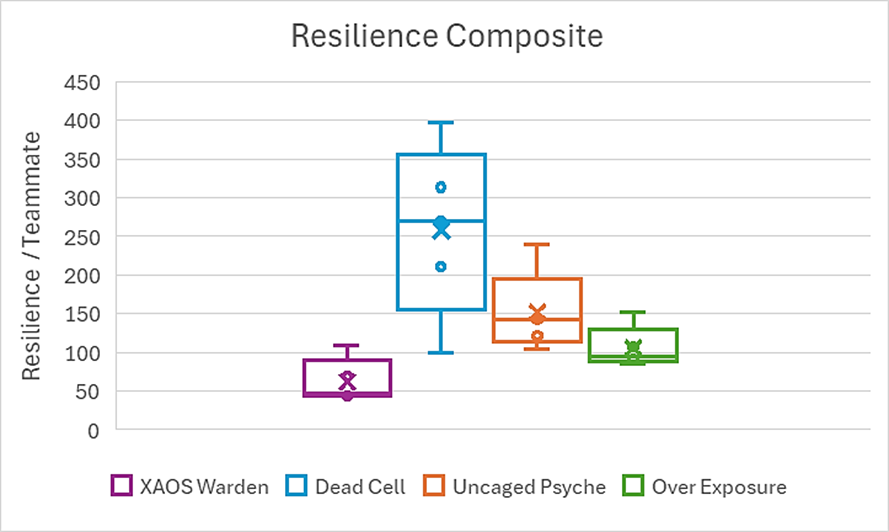
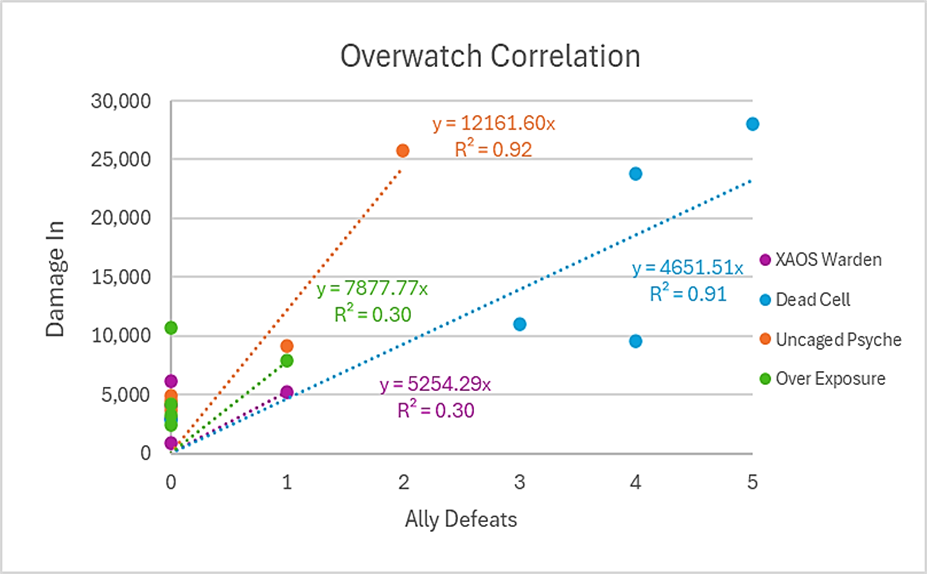
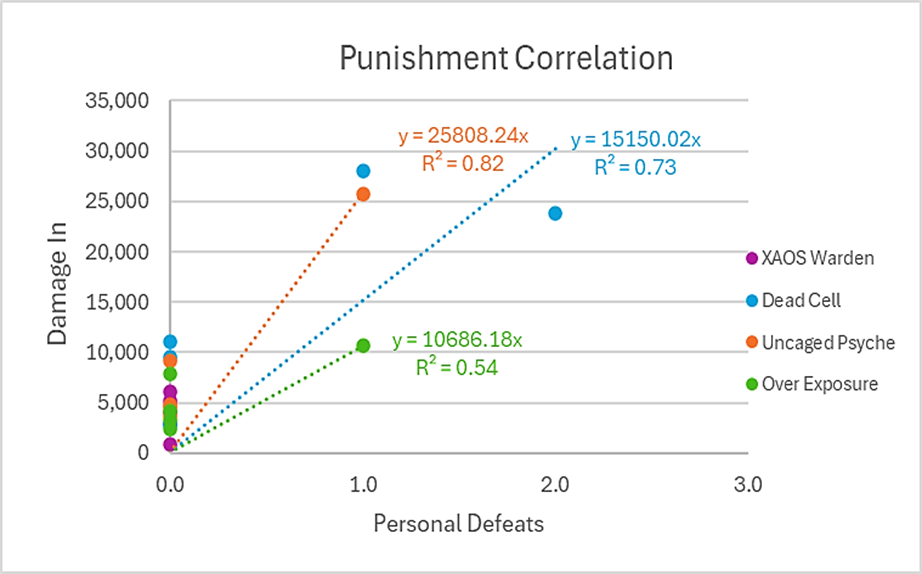
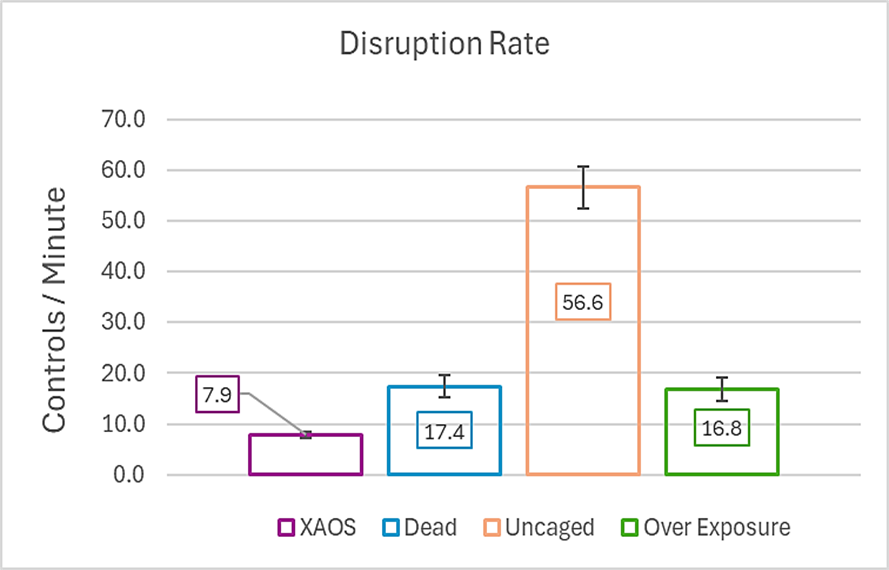
My reaction and analysis of the Scouring Sands 801 Trials team is now available for your entertainment: Mission Overview Mission 1: 801.2 IC 6034 = 28 minutes Mission 2: 801.5 W IC 6035 = 42 minutes Mission 3: 801.6 PM7 IC 6041 = 38 minutes Mission 4: 801.8 NW IC 6089 = 62 minutes* Total Time = 170 minutes *Trial ended by team decision 4 Teammates: Vilemaiden (blaster), Badgerbear (tanker), Cassie Walker (VEAT Soldier), Nate Lightning (stalker) Combined Defensive Insights Scouring Sands is a controlled-chaos mid-range controller with highly predictable defensive behavior. His defeats, ally losses, damage intake, and hit frequency all scale linearly with mission duration. He maintains consistent positioning, leading to steady hit rates and proportional damage intake. He experiences no randomness — spikes correspond directly to mission pressure, especially in cramped scenarios. His survivability is stable, his risk exposure is shared across the team, and his resilience tracks evenly with hits. This consistency under pressure makes him reliable in his chosen role, even though he willingly occupies a danger zone due to Fire/Storm mechanics. Combined Offensive Insight Scouring Sands is an escalating pressure-controller whose damage, controls, and disruption all intensify with mission difficulty. • His total damage output accelerates dramatically in tougher missions, rising from ~2,000 dmg/min early to over ~5,600 dmg/min in the final mission. • His control output surges in high-pressure encounters, jumping from ~48 controls/min early to over 150 controls/min as missions intensify. • His damage scales almost perfectly with his control output, showing that disruption directly drives his offense rather than acting as a separate function. • He maintains extremely high efficiency, dealing 13–18 times more personal damage than he takes, even as pressure increases. He deals enormous damage through overlapping Fire/Storm effects, thrives during high-pressure windows, and maintains exceptional efficiency even under fire. Combined Pet Insights Scouring Sands’ pets are high-exposure, always-active pressure partners — absorbing most incoming fire, scaling their offense with his, and supplying steady attrition damage even as their efficiency stays low — making them reliable danger barometers and consistent contributors to his battlefield footprint • Pets absorb the overwhelming majority of incoming pressure (≈80–88% of all damage on Scouring Sands’ side), making them high-exposure frontline units that consistently occupy danger zones. • Pet performance scales tightly with mission intensity — their damage taken, damage dealt, and activity all rise in the same windows where Scouring Sands himself is under pressure (R² values 0.96–0.97). • Pets contribute steady supplemental DPS (≈10–17% of total output), adding reliable attrition pressure even though their damage-per-damage-taken efficiency remains low (≈0.3–0.4). The Big Picture! Scouring Sands proves to be a pressure-driven, escalation-based controller whose offense, control, survivability, and pet synergy all intensify as missions grow more dangerous. His kit reaches peak performance in high-density, high-pressure environments, where Fire/Storm layering can operate at full magnitude. 1. His damage output accelerates dramatically in harder missions, doubling or tripling as encounters intensify (from ~2k to ~5.6k Dmg/min, R² = 0.88). His kit thrives on chaos and density — his highest output occurs exactly where difficulty peaks. 2. His control saturation scales explosively with mission intensity, jumping from ~48 to 150–160 controls per minute (R² = 0.85). Scouring Sands does not just “use more controls” in harder missions — he floods the battlefield with layered Storm and Fire effects, creating massive disruption fields. 3. His damage and controls are inseparable — nearly perfect correlation (R² = 0.99) proves he deals damage through disruption rather than alongside it. Fire/Storm for him is a single, unified engine: the more he disrupts, the more he burns. There is no divide between CC and DPS. 4. He maintains exceptional personal efficiency, dealing 13–18× more damage than he takes, even in high-exposure positions (Character Effectiveness ratio avg ≈ 13.3, rising to 18.1). He trades extraordinarily well for a controller — absorbing mid-range fire while massively out-damaging incoming threats. 5. His pets absorb ~80–88% of all damage taken on his side of the ledger, scaling their activity tightly with mission danger (R² = 0.96–0.97) and contributing steady supplemental DPS (10–17%). They are durable, predictable, and fully synchronized with his tempo — frontline pressure partners that reveal danger windows and extend his damage field.
-
DEFCON II: AFTERMATH — Do Controllers Still Outscale Defenders?
Dark Current replied to Dark Current's topic in Archetypes
Wow! Scouring Sands and the FAFO Company with special guest star @Linea took it to the 801s, successfully completing the first Four Tiers of the Trial without a team wipe! This is the first team to make it that far without any technicality (Gyr Falcon, my Cold / Archery defender's team made it that far, but there were some hospital violations by a pug that joined to fill a vacant team slot during the Tier 4 mission). It took nearly 3.5 hours of non-stop battle to make it that far, but the team remained unbroken at the end. You can check out the streamed vid on my Twitch Channel here: https://www.twitch.tv/videos/2613426728?t=00h14m52s I'll upload the edited vid with commentary to YT in the coming days, so stay tuned!
-
DEFCON II: AFTERMATH — Do Controllers Still Outscale Defenders?
Dark Current replied to Dark Current's topic in Archetypes
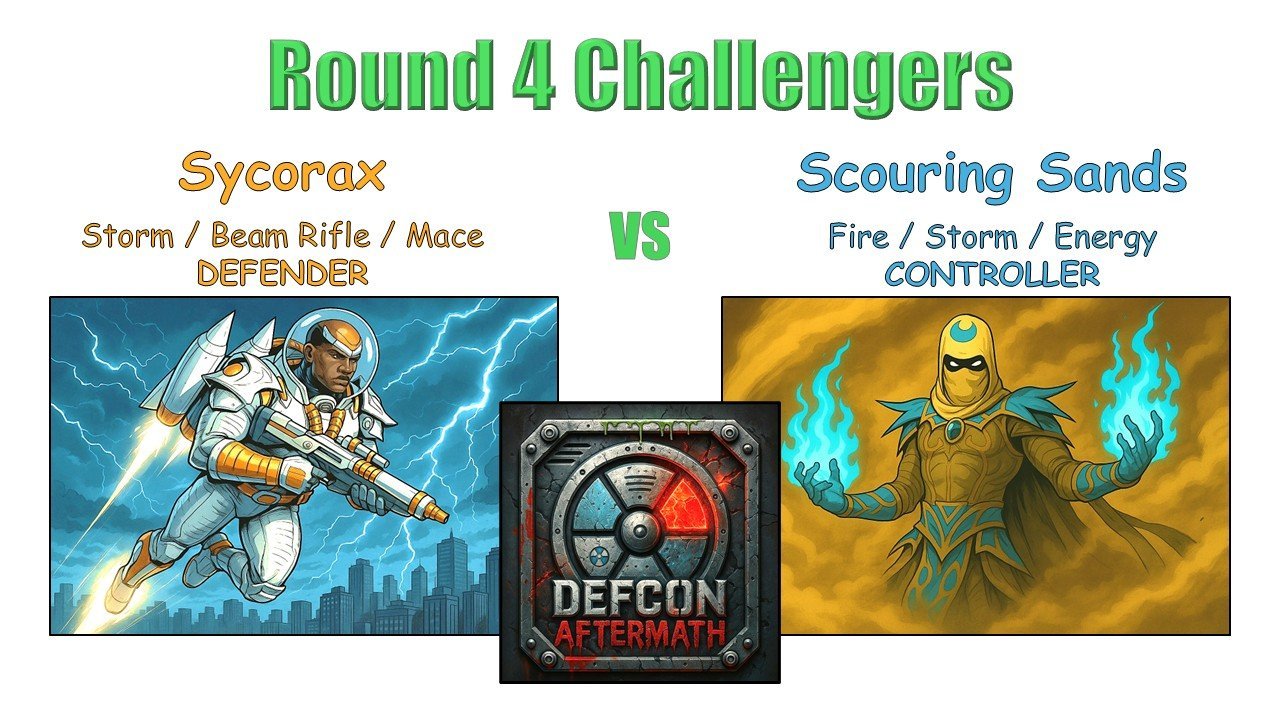
Sycorax, a Storm / Beam / Mace Defender build... Grab the MIDS here! Sycorax - Defender (Storm Summoning).mbd -
DEFCON II: AFTERMATH — Do Controllers Still Outscale Defenders?
Dark Current replied to Dark Current's topic in Archetypes
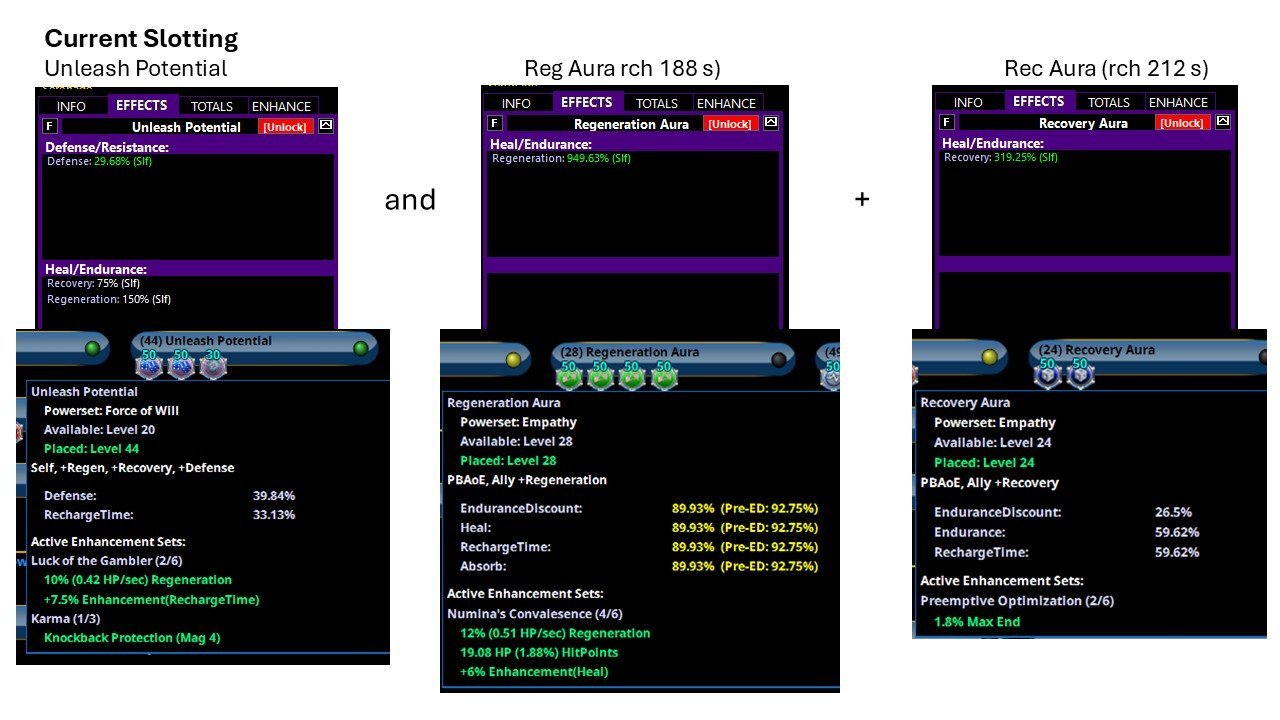
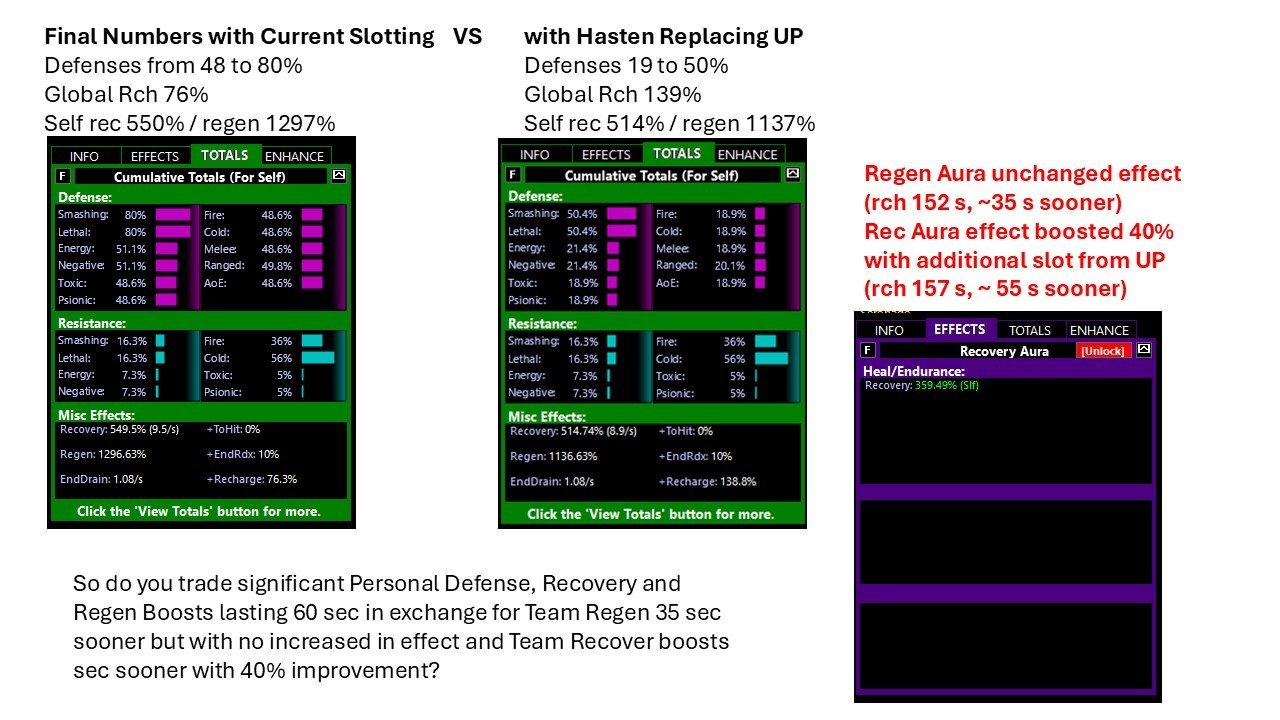
I definitely want to counter this point though, as you're underselling UP big time. Here is a hypothetical exchange of UP for Hasten and moving a 3rd slot to UP with Hasten slotted 2x with 50+5s... My answer to that question is 'No'. Giving the team sooner regen and recovery wouldn't have stopped the 801s from perforating us with those stampedes of ambushers unleashing Beam Rifle blasts. Now if you're going to then tell me to drop the Force of Will pool and not take Ice Armor as well, then I'm no longer playing Frisson Sensate who is based around a psychic and chilling theme, which is his whole point.
-
DEFCON II: AFTERMATH — Do Controllers Still Outscale Defenders?
Dark Current replied to Dark Current's topic in Archetypes
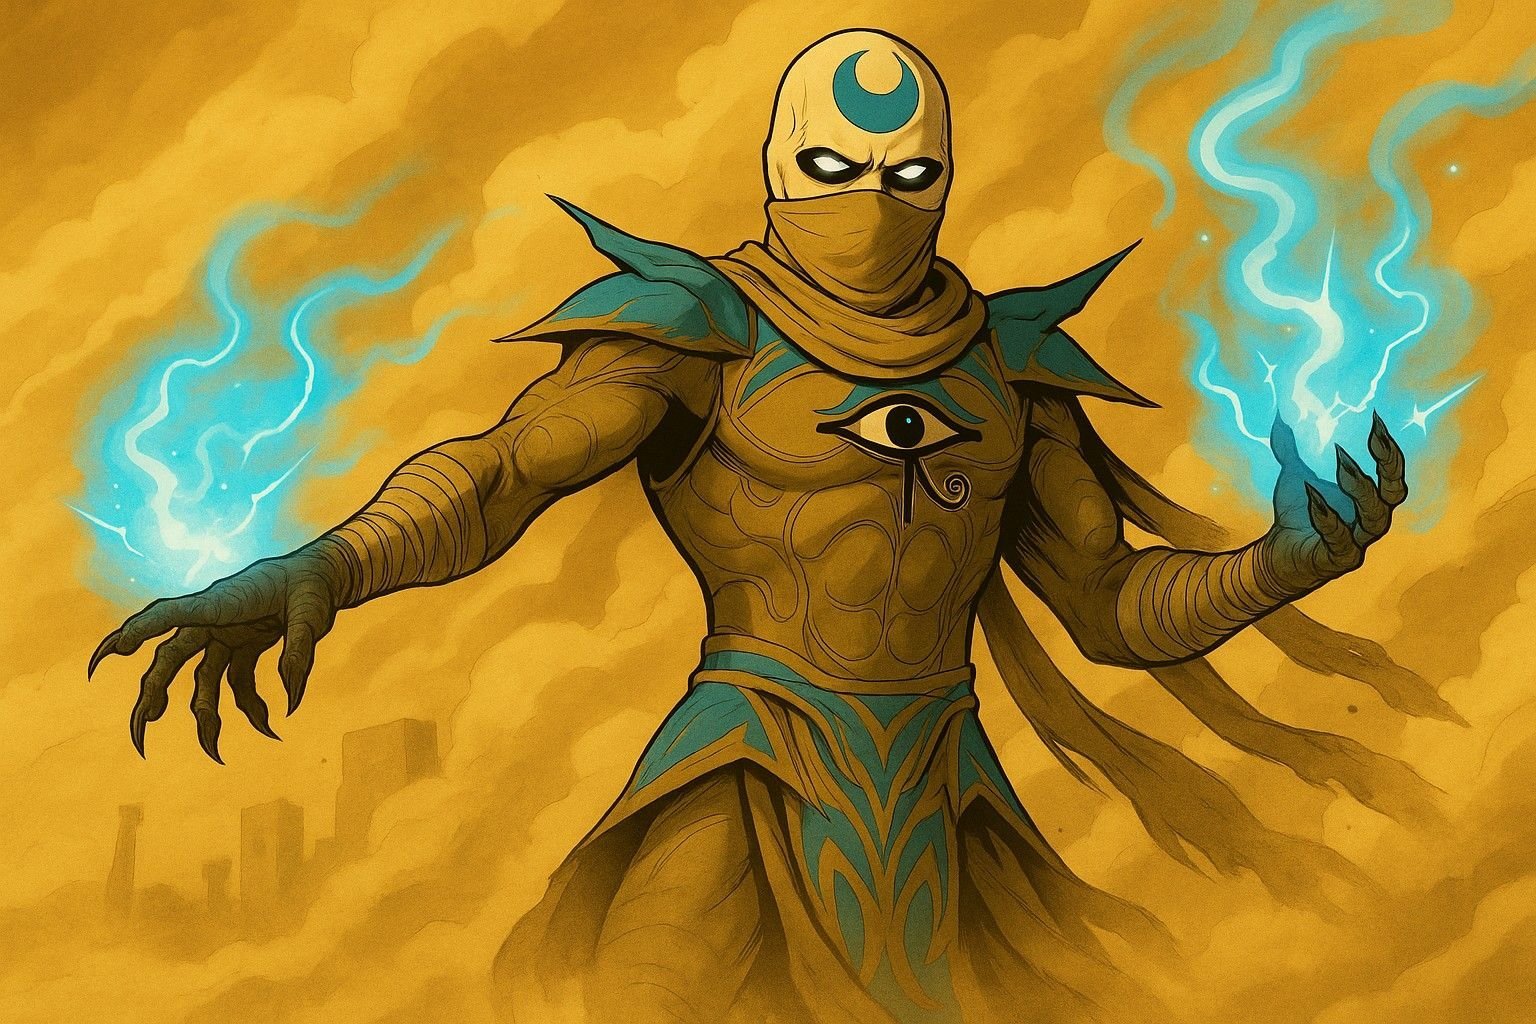
Scouring Sands, the Desert Demon! Fire / Storm / Energy Controller build. Download MIDS build here: Scouring Sands - Controller (Fire Control - Storm Summoning).mbd Watch the Build walk-through and Solo Test video here: -
DEFCON II: AFTERMATH — Do Controllers Still Outscale Defenders?
Dark Current replied to Dark Current's topic in Archetypes
Head to your basements and bathtubs! It's time for the next DEFCON: Aftermath match up!
-
DEFCON II: AFTERMATH — Do Controllers Still Outscale Defenders?
Dark Current replied to Dark Current's topic in Archetypes
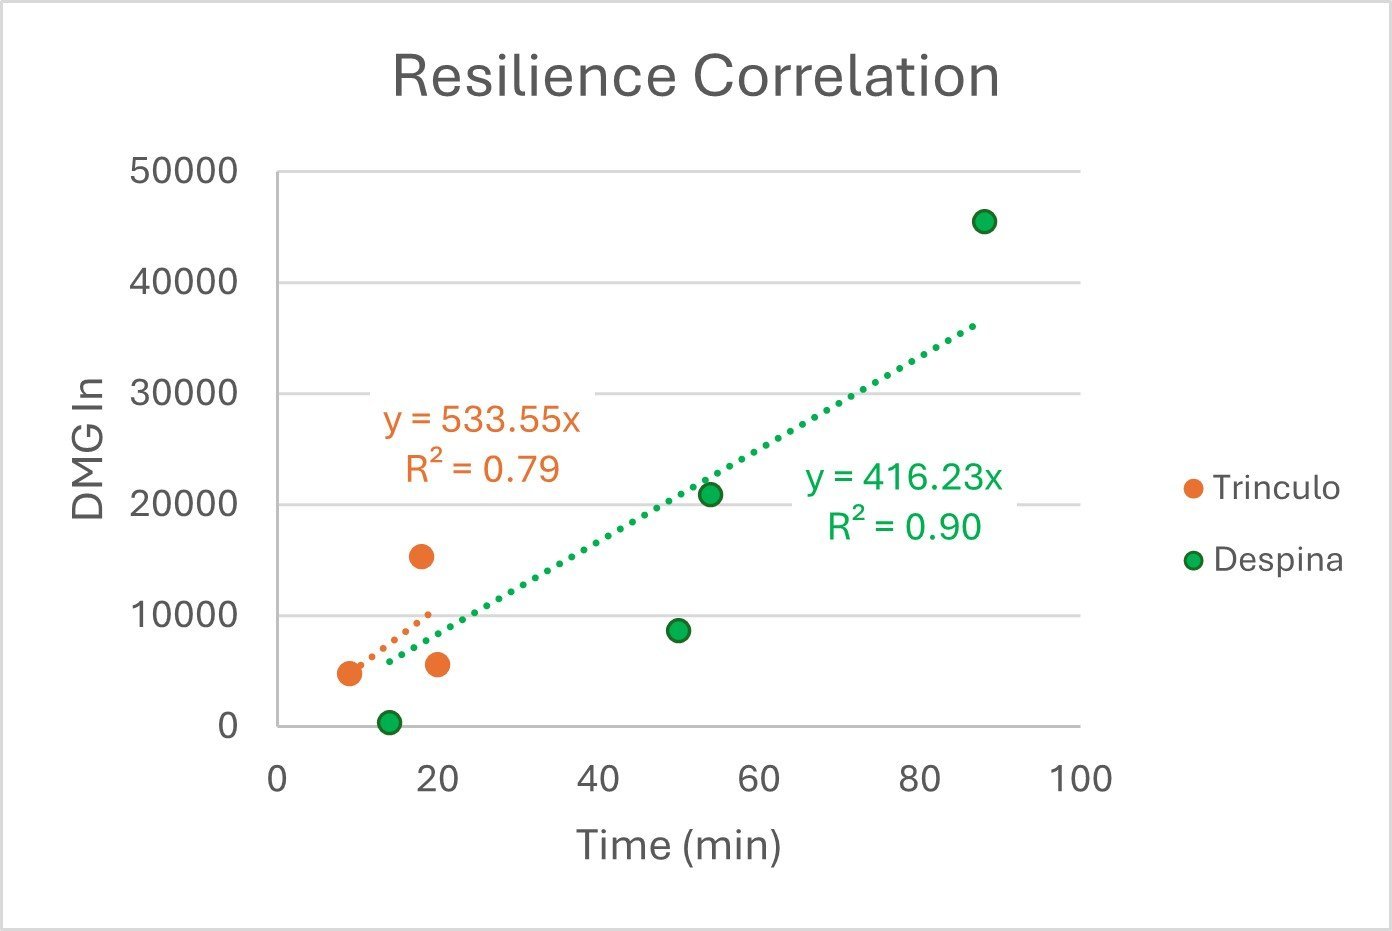
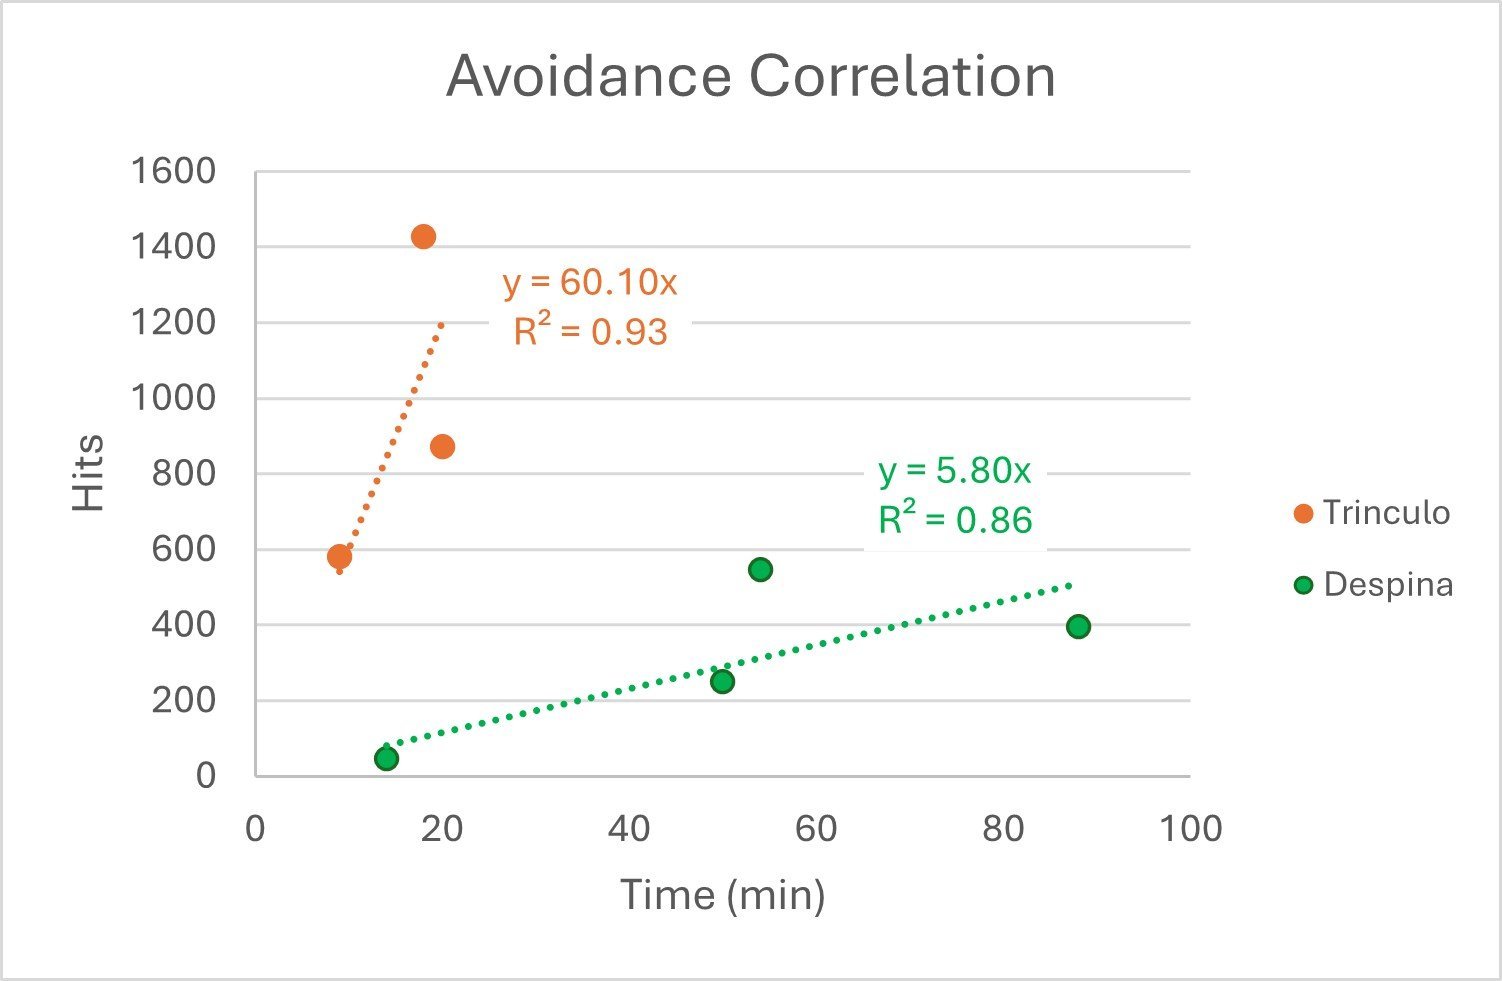
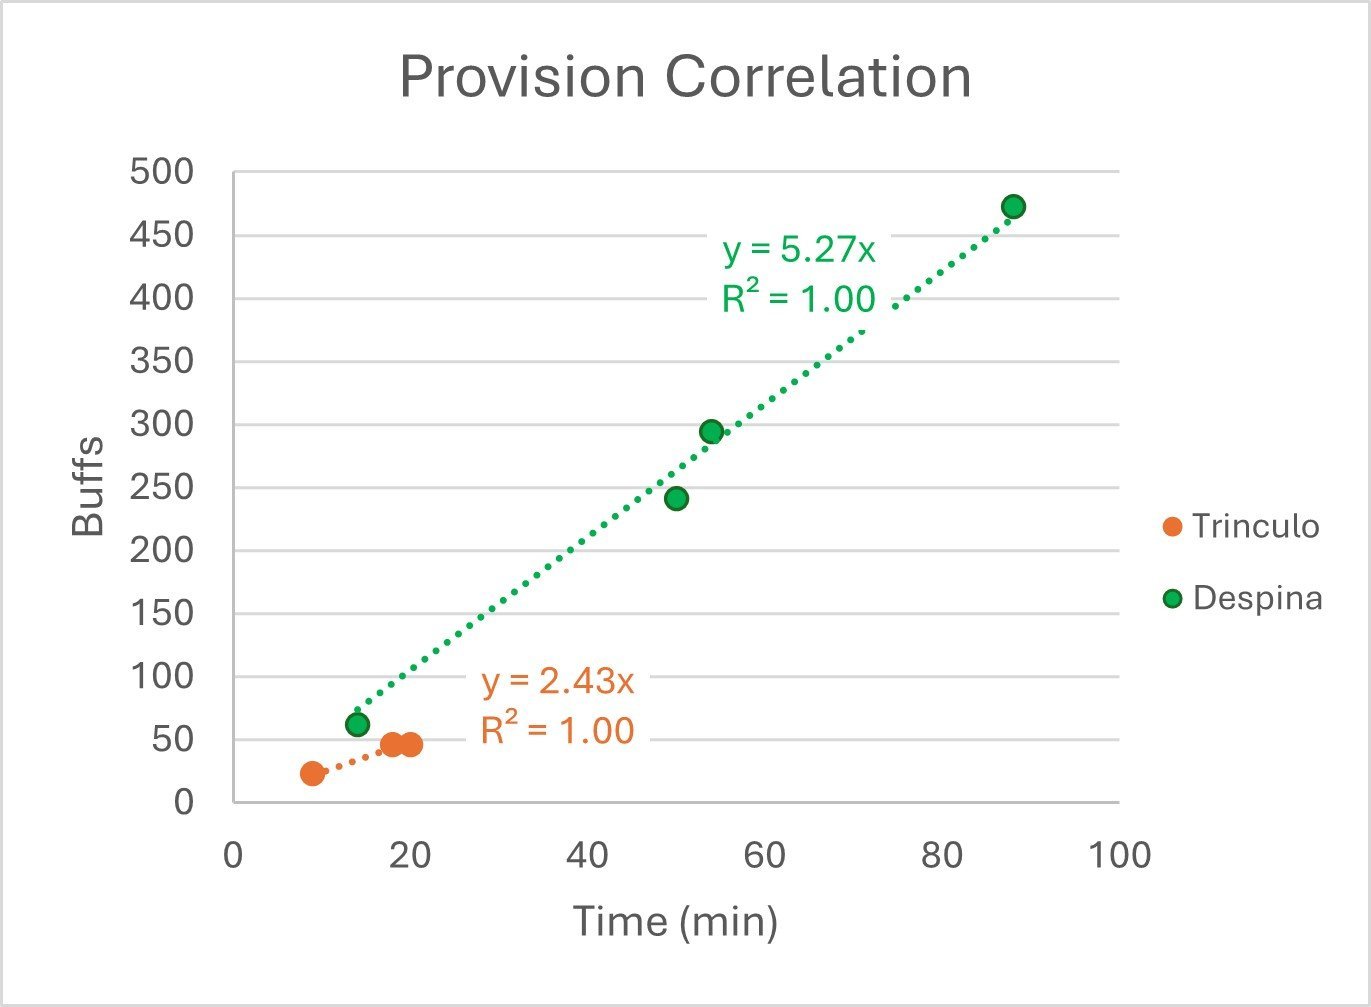
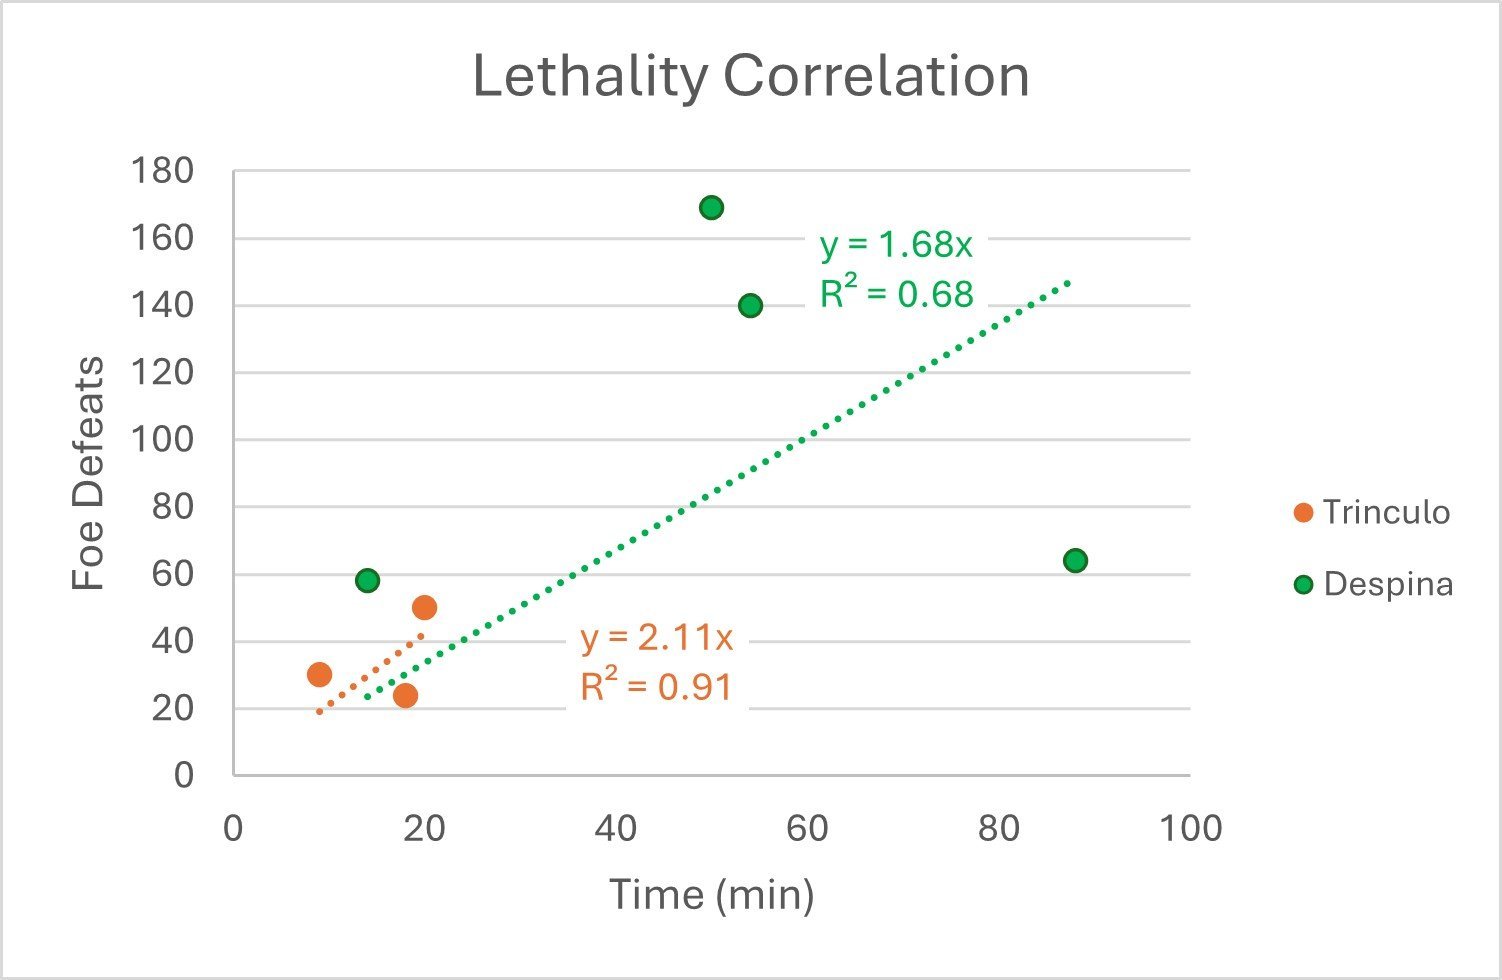
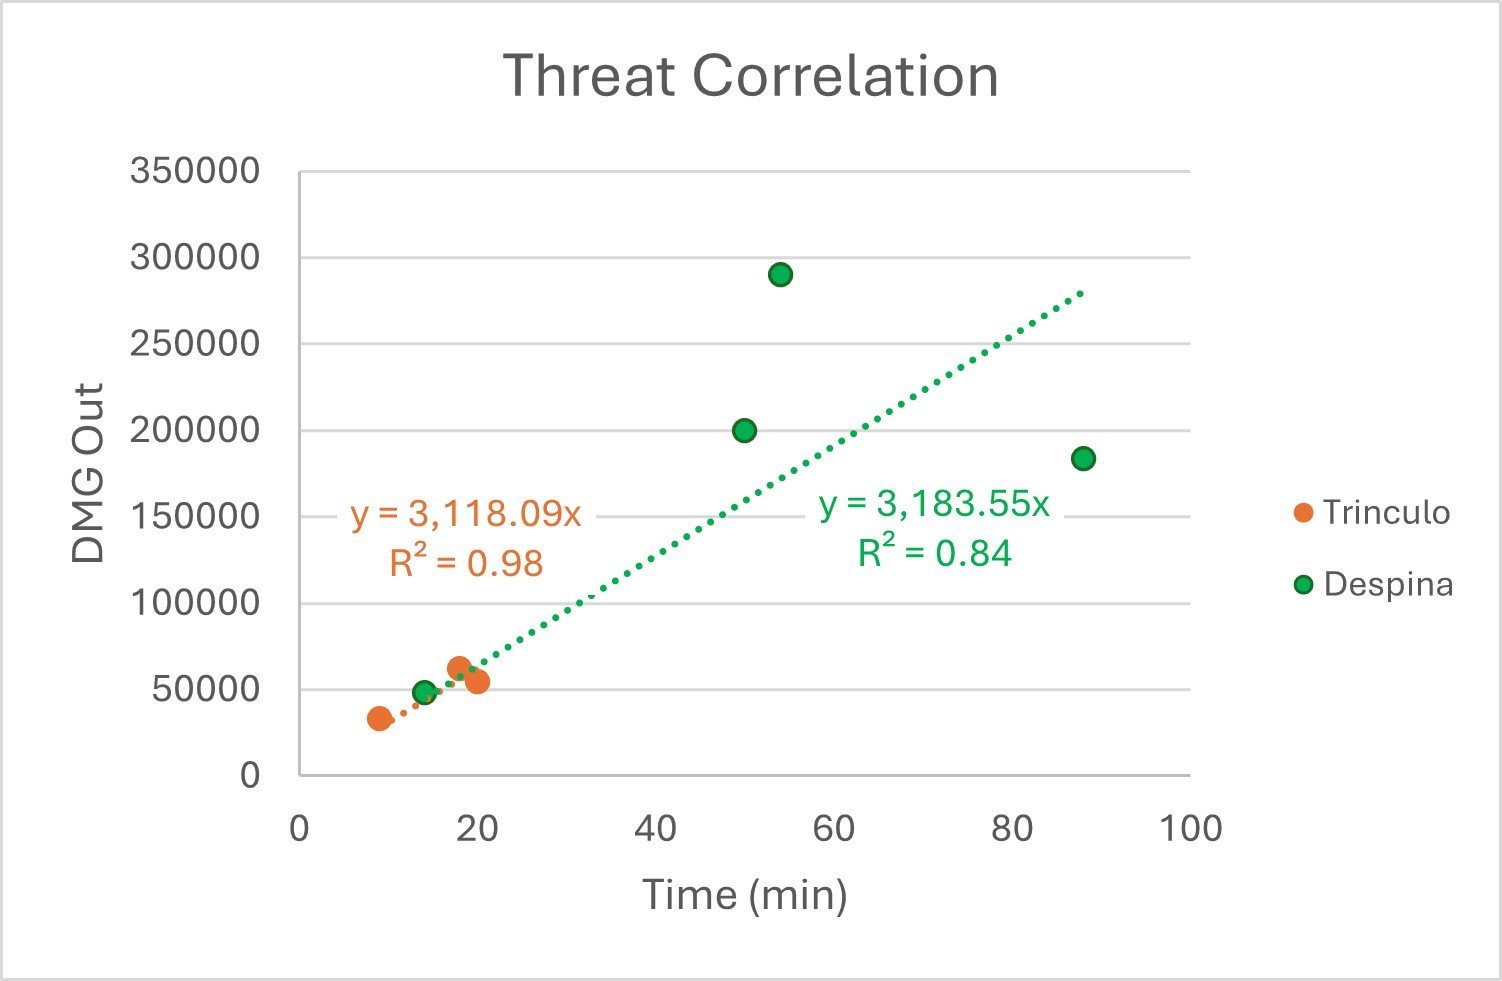
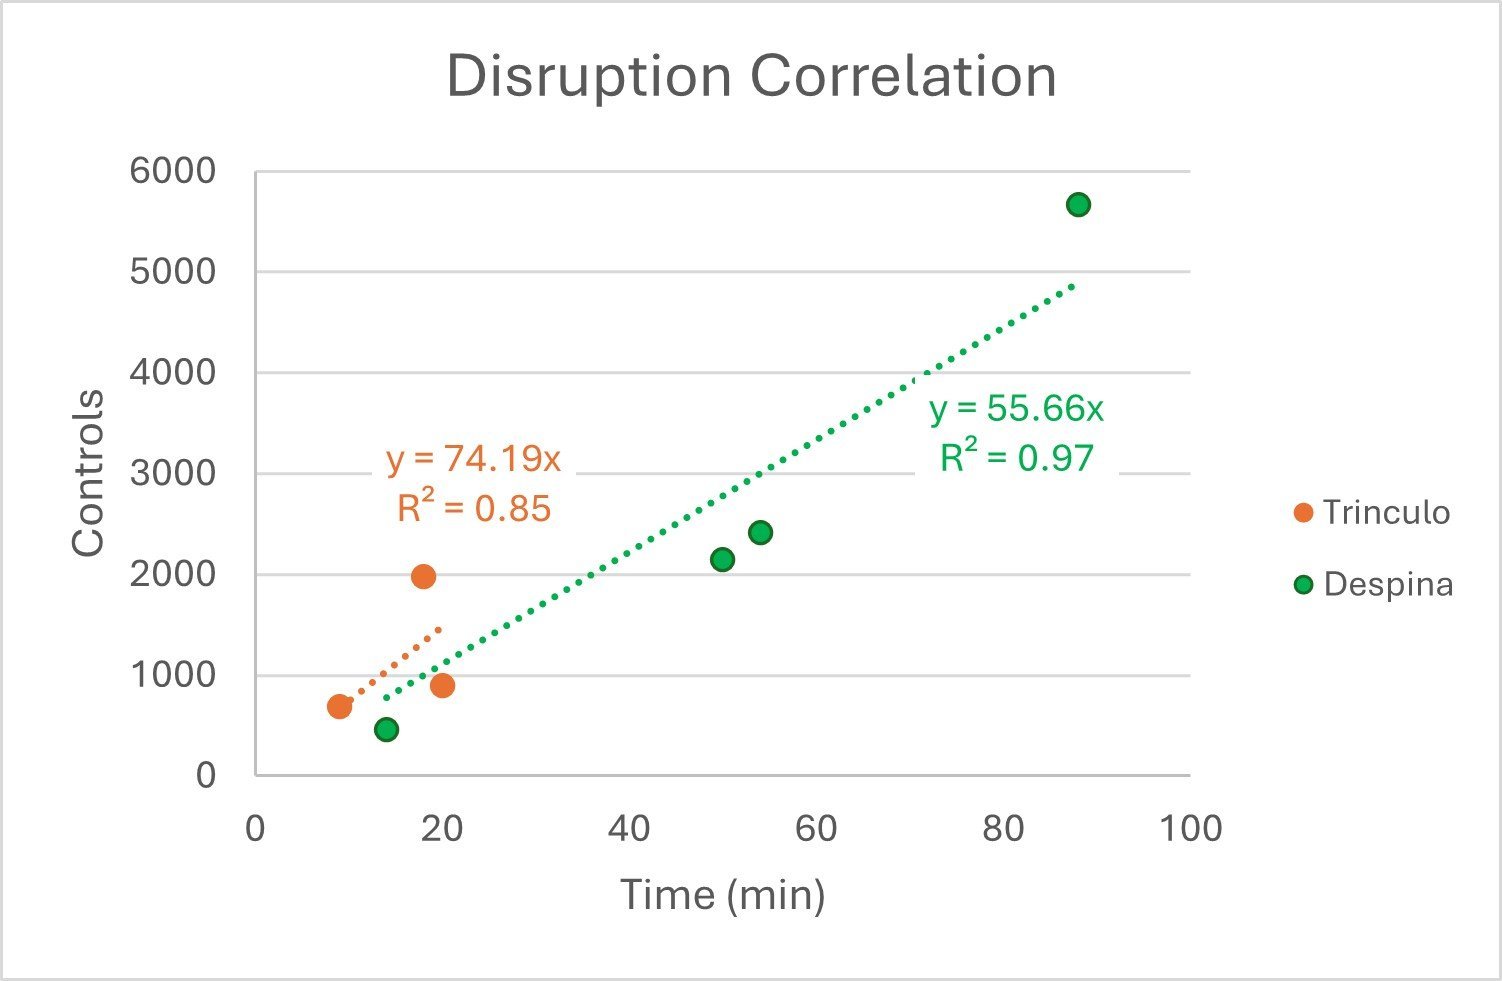
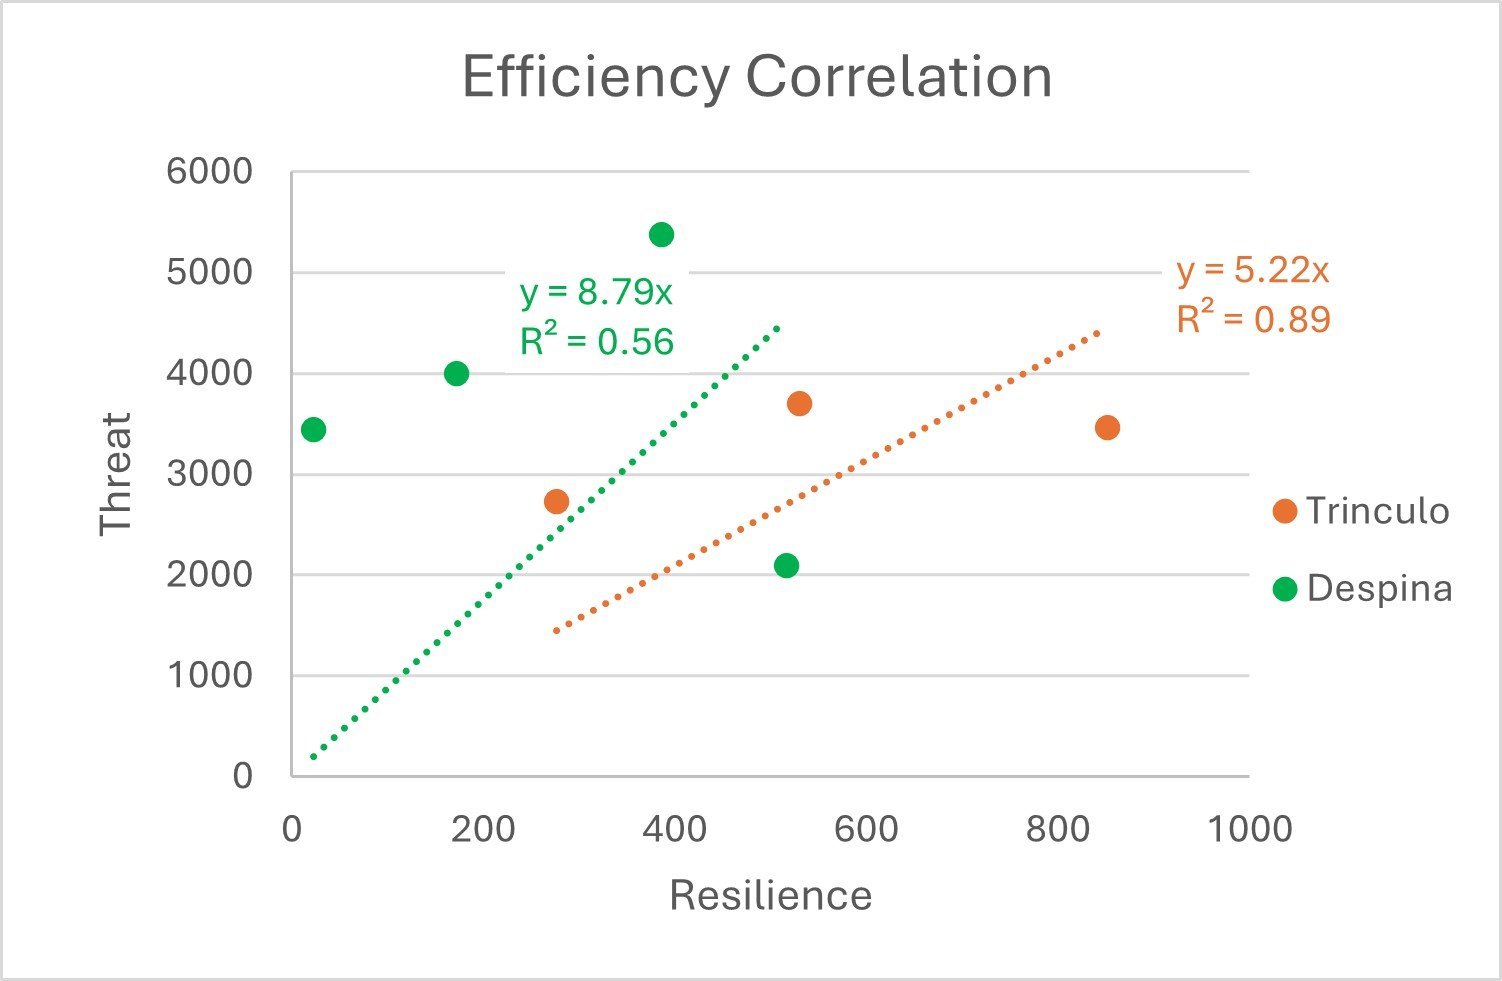
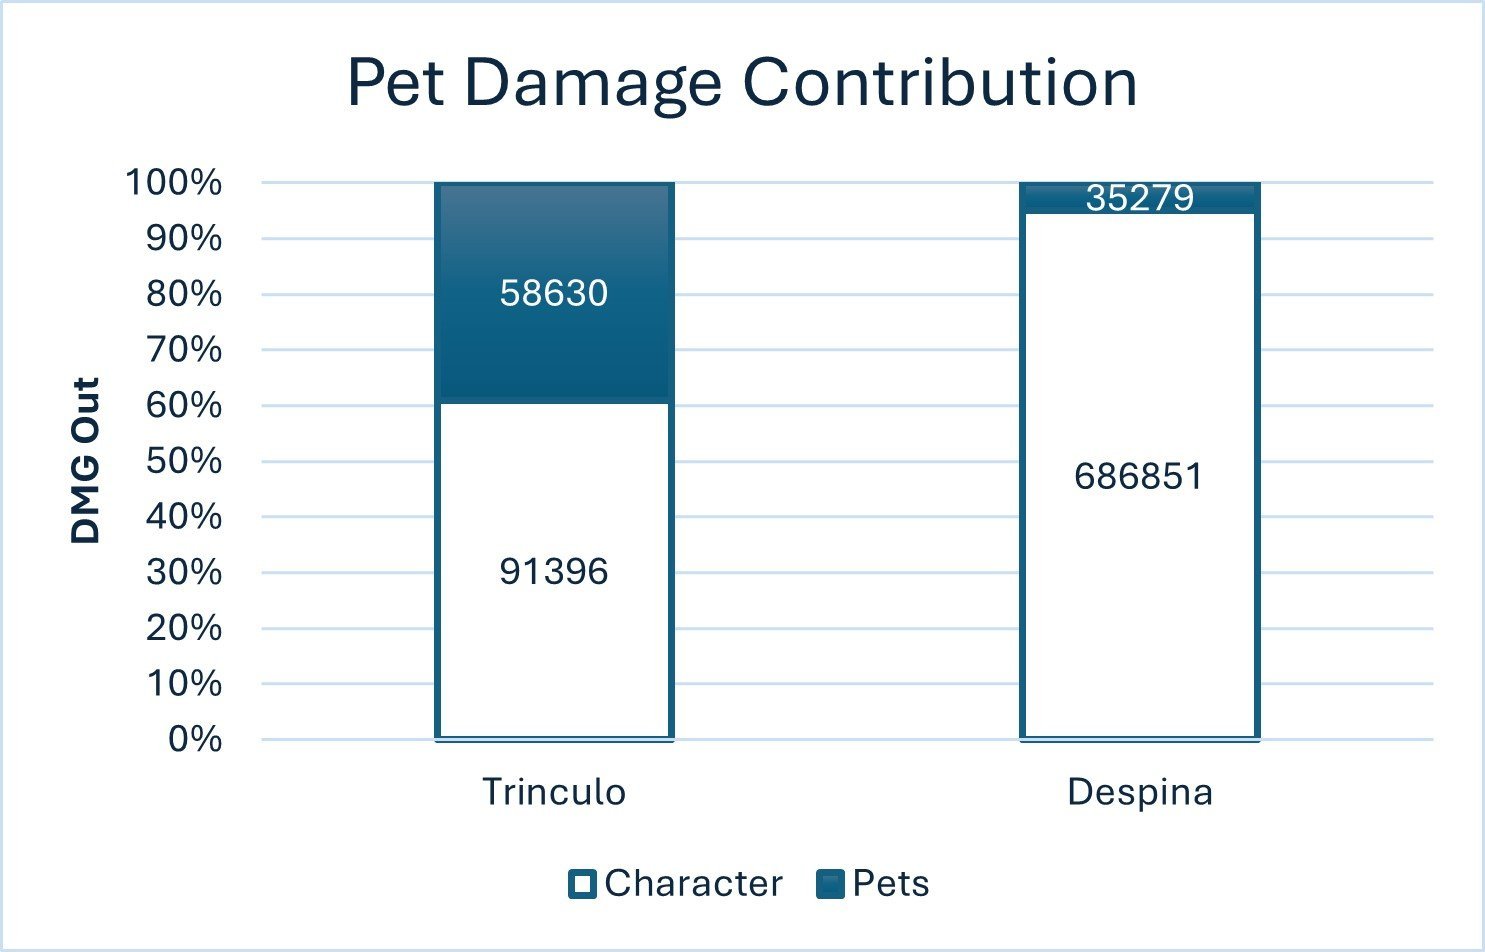
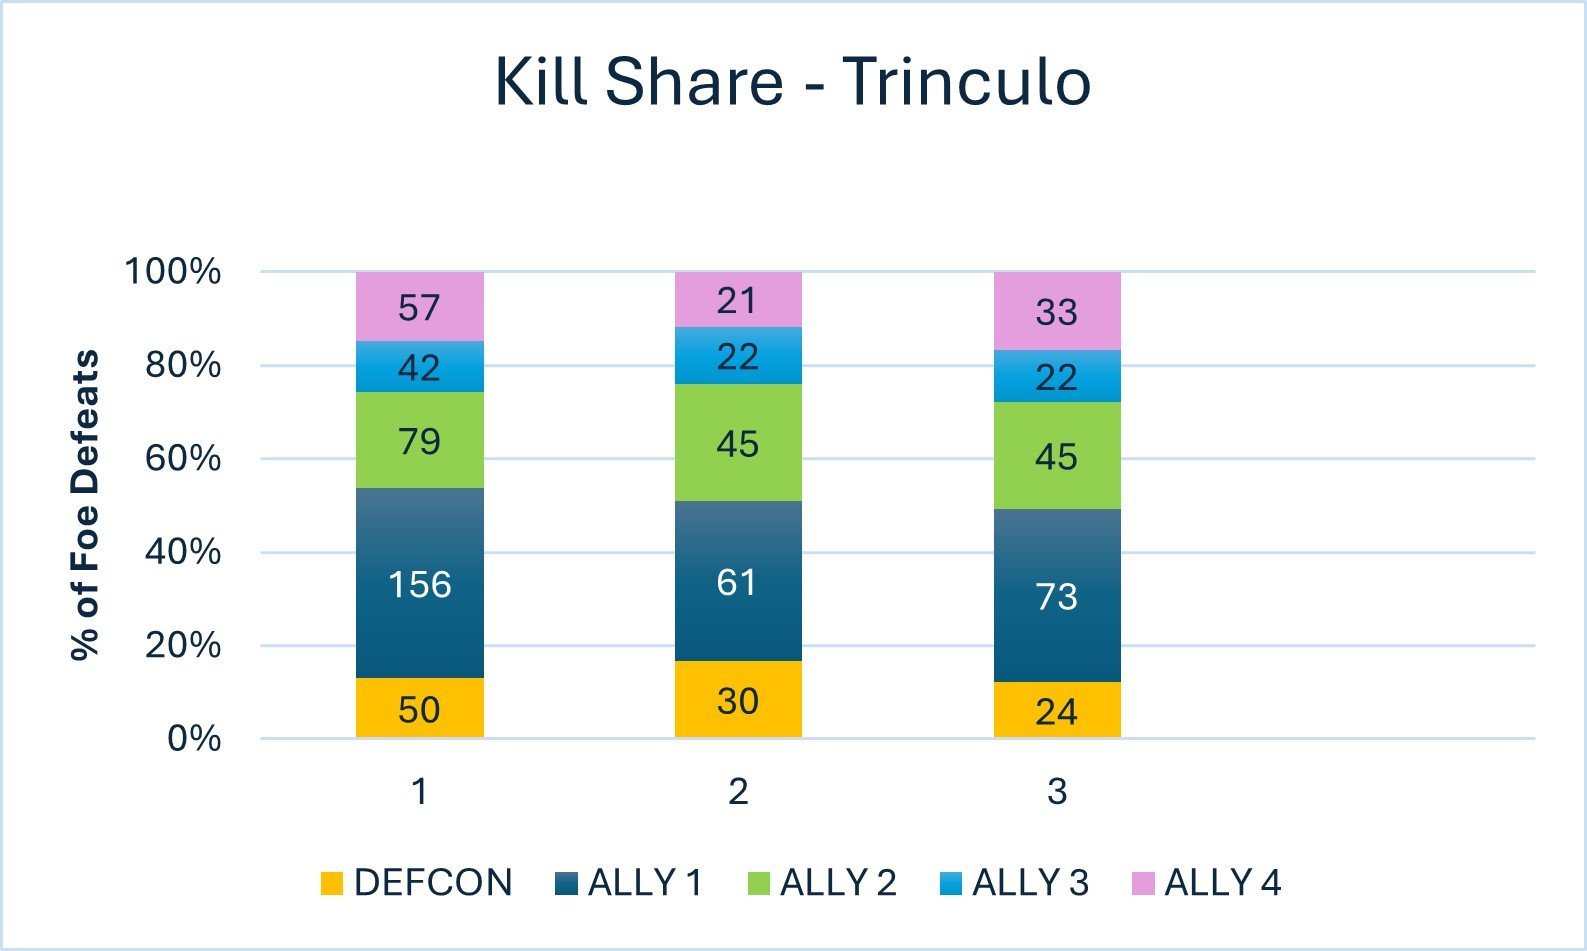
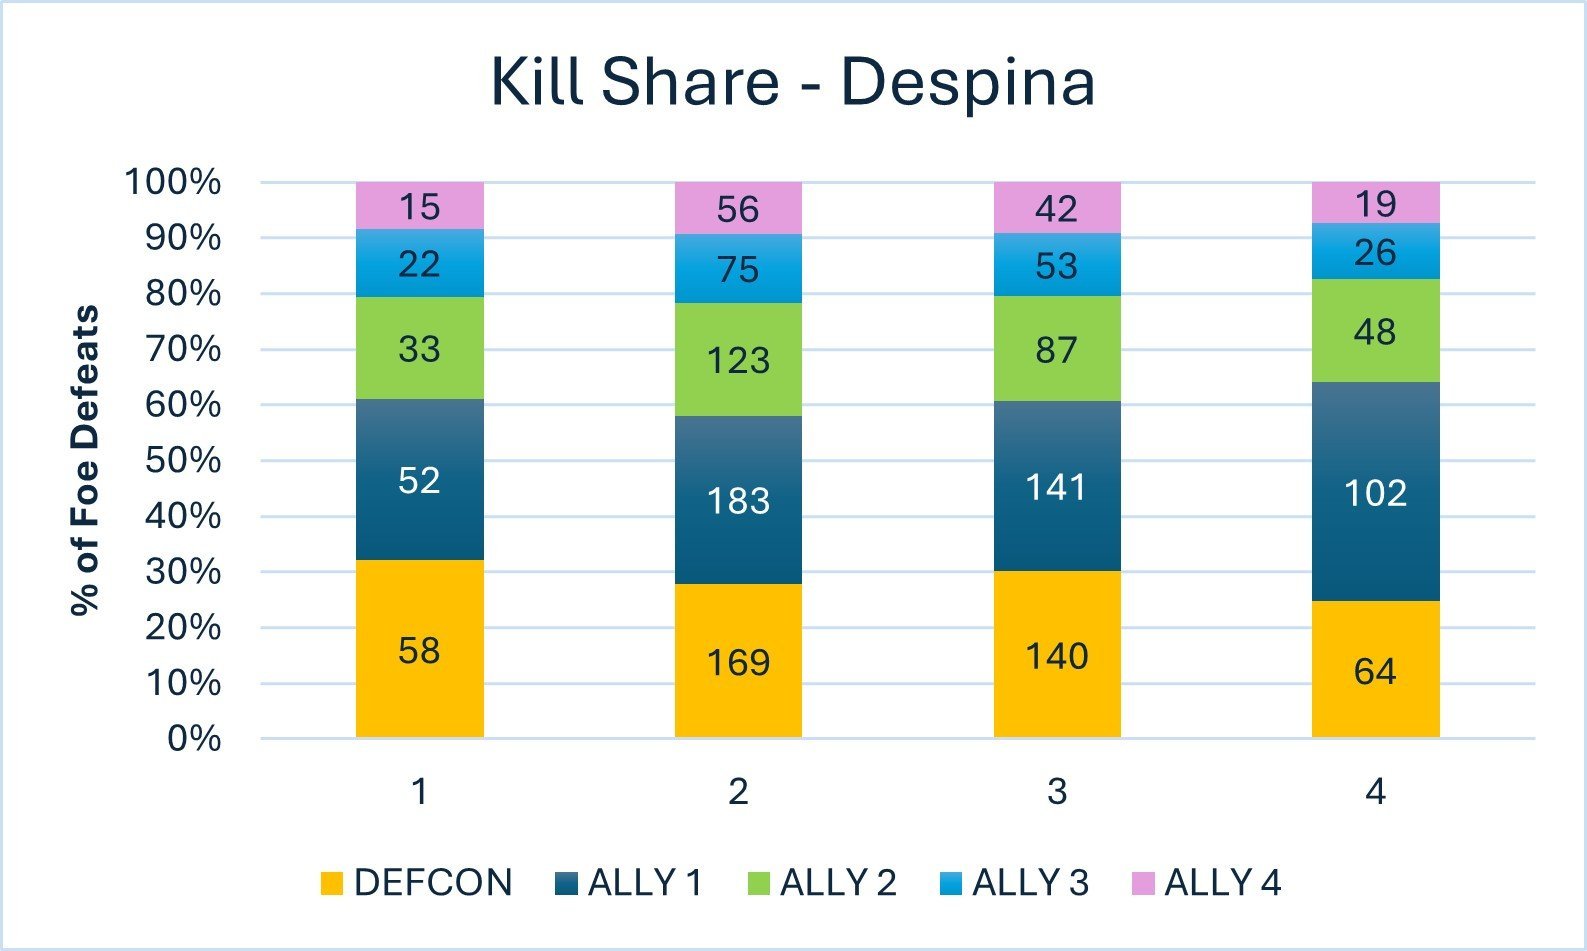
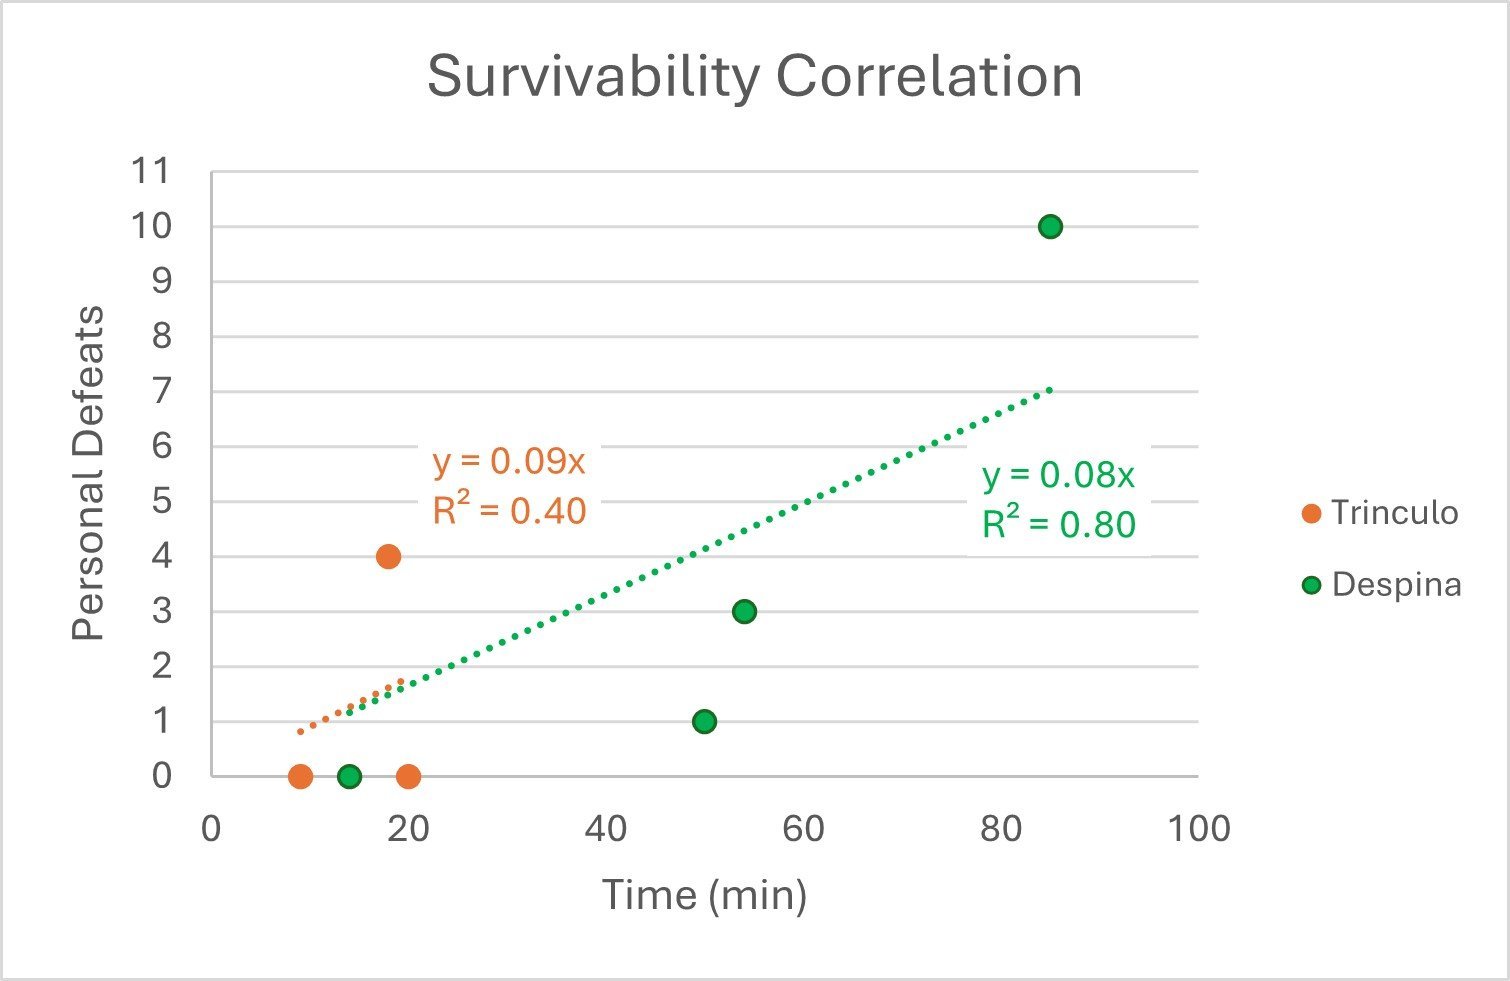
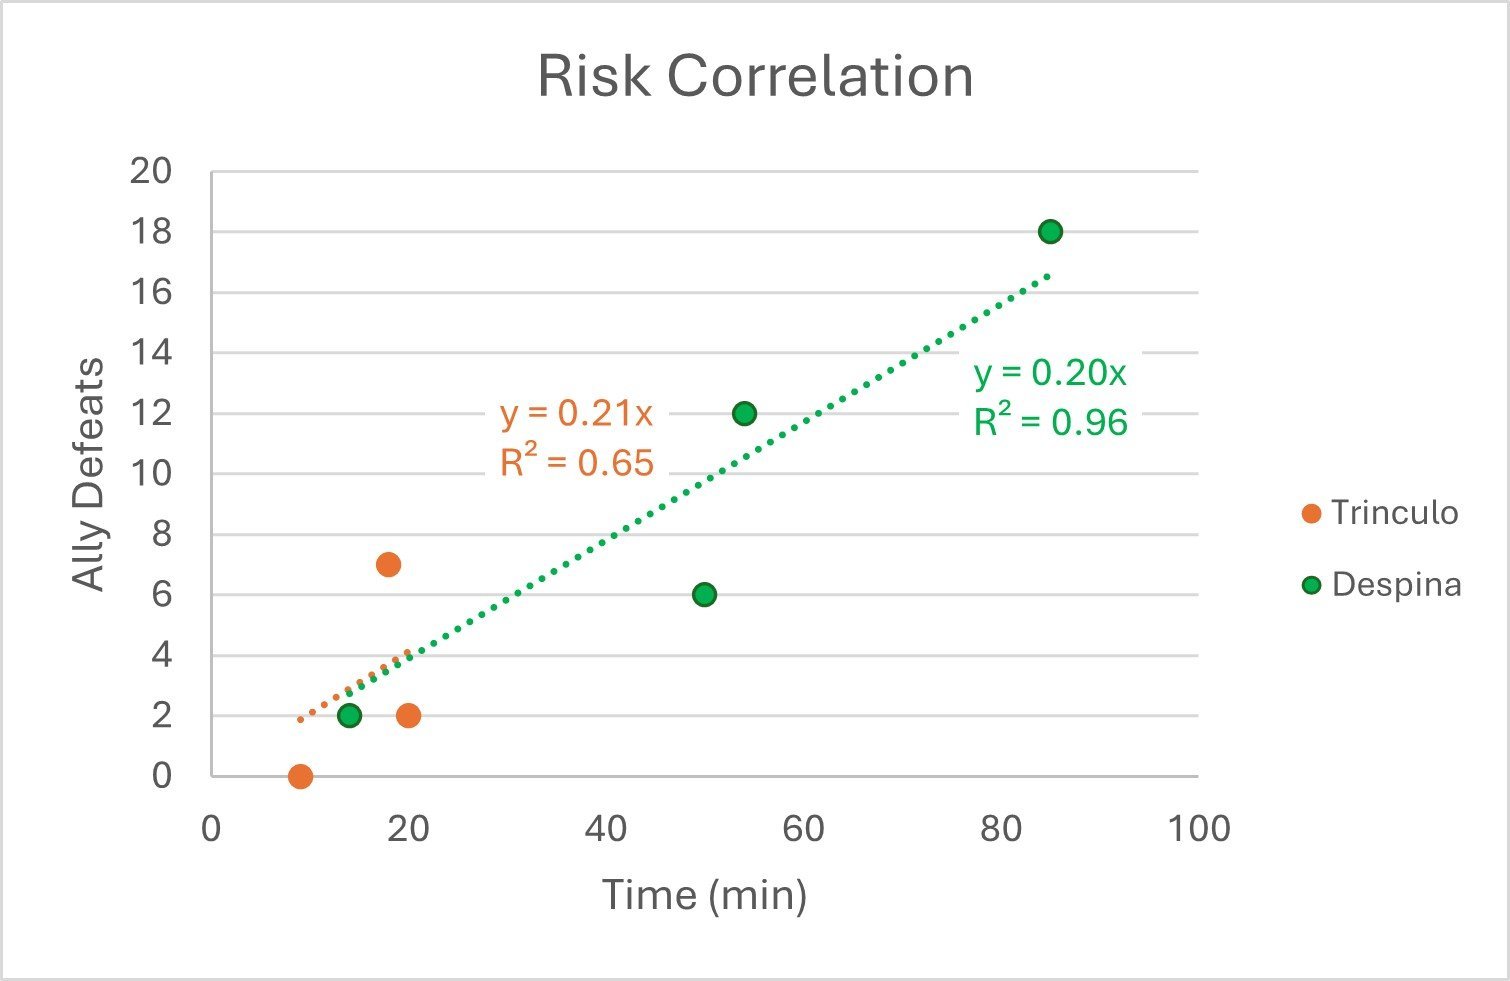
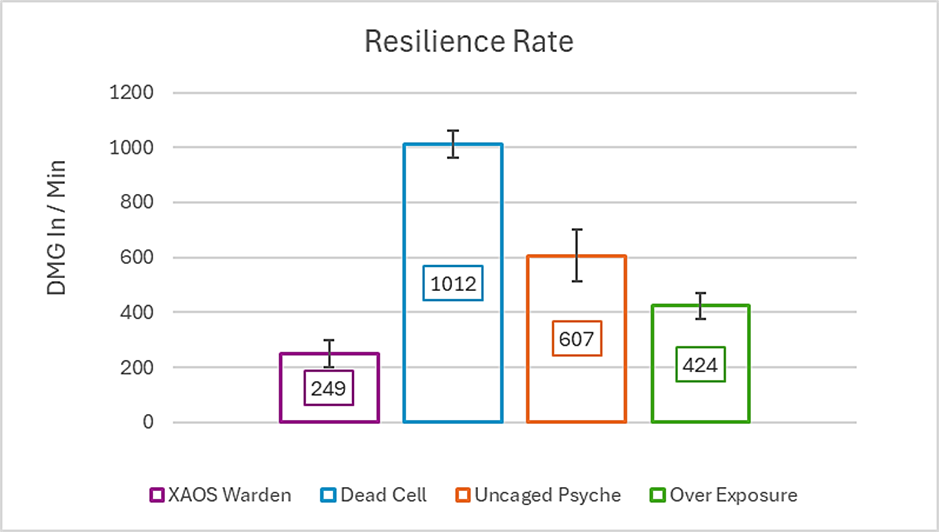
So, who won the matchup between DEF and CON with Radiation??? Defensive Metrics Defensive Summary Survivability: Despina fell more times overall, but over quadruple the time. Her defeat rate (0.026 vs 0.074) was far lower and steady (R² = 0.93 vs 0.40). Edge Despina. Ally Risk: Despina’s team had more total defeats, but fewer per minute (0.14 vs 0.16). Her protection held better over time. Resilience: Trinculo absorbed roughly 2× more damage per minute (553 vs 274), fighting in hotter zones while Despina managed longer, cooler engagements. Tie by context. Punishment: Trinculo withstood heavier burst (212 vs 143 dmg/min per defeat), but Despina’s loads were cooler and more controlled. Edge Trinculo (short burst), Edge Despina (sustained). Overwatch: Despina’s team defeats were less linked to her own damage intake (30 vs 123). She stayed steady when allies fell. Pets (Loyalty + Sacrifice): Trinculo’s 5 pets took more hits by design; Despina’s 2 pets faced little exposure. Different risk models, functional tie. Avoidance: Trinculo logged 10× more hits/min (62 vs 5.7) from AoE ticks; Despina simply stayed out of harm’s way. Winner Despina. Targeting: Each hit on Trinculo did ≈9 dmg vs Despina’s ≈61. He soaked volume, she dodged spikes. Winner Trinculo. Provision: Despina maintained double the buff tempo (5.0 vs 2.5 buffs/min) with perfect consistency. Clear edge Despina. Warding: Buff rate rose slightly with defeats for both (R² = 0.52 vs 0.62); Despina’s flatter curve (0.37 vs 0.42) shows minor preventive edge. Shielding: Despina’s flatter slope (42 vs 374 dmg/min per buff) indicates better efficiency, but low pet count deflates it. Contextual tie; Edge Despina overall. Verdict Defensive Winner: Despina — the steadier, preventive supporter. Despina minimized exposure, kept her buff cycle flawless, and held steady through long, grinding missions. Trinculo absorbed more fire and handled it well, but his frontline presence and reactive buffing made his defense more volatile. Takeaway Both Radiators endured their environments well, but Despina did so calmly and predictably — controlling danger before it escalated. Trinculo thrived in the blast zone, absorbing chaos through sheer toughness. Defensively: Despina prevents the collapse; Trinculo survives it. Offensive Metrics Offensive Summary Lethality: Both DEFCONs averaged similar foe defeats per minute, but Despina sustained her kill tempo across four missions. Trinculo’s shorter but sharper runs delivered higher burst ratios. Despina edges it for overall endurance; Trinculo for volatility. Amplification (Buffs → Ally Kills): Trinculo’s smaller buff volume translated into higher team payoff. His allies’ kill totals rose steeply in step with his buffing activity, proving his Radiation fields and Conductive Aura amplified ally aggression more directly than Despina’s steady Water-based sustain. Threat (Raw Output): Despina dominated with over 720k total damage—a staggering number even factoring pets. Trinculo’s 150k reflects shorter exposure time and mixed melee risk. On output alone, Despina wins outright. Potency (DMG Out vs. Kills): Both scaled damage effectively with foe defeats, but Despina’s steeper slope indicates better kill-to-damage efficiency. Her Water Blast toolkit produced faster returns per spike. Disruption (Control Rate): Despina generated three times more control events across missions, but Trinculo’s forgotten Choking Cloud suppresses his real potential here. Adjusted for uptime, the sets likely approach parity. Efficiency (DMG Out / DMG In): Despina achieved an average 9.1:1 ratio—more than double Trinculo’s 3.6:1. Her ranged positioning and layered debuffs turned offense into defense, minimizing trade cost. Pet Contribution: Trinculo’s five summons produced 60% of his total damage, working in perfect sync (R² = 0.96). Despina’s pets delivered just 5.6%, but with 3.3× efficiency. → Trinculo’s pets were shock troops; Despina’s were amplifiers. → Trinculo wins Aggression and Savagery; Despina wins Efficiency. ⚖️ Verdict - Despina is the superior offensive architect; Trinculo is the superior offensive catalyst. Despina channels overwhelming ranged damage, clean kill efficiency, and unmatched sustain. Her numbers represent strategic dominance—damage delivered precisely, safely, and consistently. Trinculo operates as a tactical instigator—faster to surge, faster to burn, but terrifying in momentum. His buffs and pets spike his team’s damage with every engagement, even at personal cost. 💡 Takeaway Despina: Command of the field. Sustained firepower, reliable returns, minimal exposure. Trinculo: Command in the moment. Aggressive amplification, synergistic pet warfare, volatile bursts. Final Verdict… In this Radiation duel, Despina emerges as the superior DEFCON supporter because… Defensively, she was steadier and more sustainable. Trinculo’s team folded sooner and more often, while Despina’s endured through longer, harder missions. Her lower defeat rate per minute and superior buff throughput gave her squad the stamina to survive deep into Tier 4 — territory Trinculo’s team never reached. His resilience under pressure was higher per defeat, but that came from hotter incoming fire and a thinner frontline. Despina simply kept her machine running longer, cleaner, and with fewer collapses. Offensively, the gap widened. Despina out-damaged Trinculo nearly five to one, converting her pressure into clean, decisive kills. Her attacks hit harder, scaled faster, and paid off in sustained enemy defeats. Trinculo’s Radiation fields and pets hit in furious bursts, but the momentum burned out quickly. His team’s kill tempo rose when he spiked — then flatlined when he fell. Despina’s output, by contrast, never stopped climbing. And when it came to support impact, Despina’s precision trumped Trinculo’s chaos. She buffed twice as fast, healed more consistently, and turned damage mitigation into forward motion. Trinculo’s disruption tactics and pet aggression were brutal, but costly — efficient in short runs, unsustainable in a campaign of attrition. 🧩 What if you focus on the First Three Missions Only…? Even when you remove Mission 4 entirely, Despina still wins 5 of 6 categories, and by wider margins than she loses any. The biggest shift is scale — the victory changes from overwhelming to decisive but fair. Her advantages in duration, buff coverage, and kill conversion still dominate the shared timeline. Trinculo fought hot and hard in shorter bursts, surviving well enough but failing to translate control into kills or reliable prevention. Despina, even within the same time window, proved steadier, safer, and far deadlier — producing more buffs, more kills, and fewer team losses at half the incoming pressure per minute. So yes — even stripping away her marathon fourth mission, Despina still wins the head-to-head, though the result shifts from a landslide to a commanding decision. ⚖️ Bottom Line Trinculo: The volatile amplifier — fearless, explosive, and team-driven, but burning twice as bright for half as long. Despina: The irradiated engine — stable, lethal, and inexhaustible, turning every joule of power into measurable results. DEFENDERS Win Radiation Emission!!!
-
DEFCON II: AFTERMATH — Do Controllers Still Outscale Defenders?
Dark Current replied to Dark Current's topic in Archetypes
Here's the full Trial video downloaded from my Twitch channel. And here's my reaction and analysis of that Trial's performance, which includes the Verdict on Radiation -
DEFCON II: AFTERMATH — Do Controllers Still Outscale Defenders?
Dark Current replied to Dark Current's topic in Archetypes
Here is my Radiation Defender's Build and Solo testing: Despina the Toxic Tide! Rad / Water / Energy Defender Build MIDS Build:Despina - Defender (Radiation Emission).mbd Build Walk-through and Solo Test Video: -
DEFCON II: AFTERMATH — Do Controllers Still Outscale Defenders?
Dark Current replied to Dark Current's topic in Archetypes
Thanks for the insights, Linea. I'm not super concerned about standardizing mission size / spawn number as that randomness is part of the testing. At the end of the day, I'm going to have 5 defenders and 5 controllers' cumulative data to compare with multiple teammates and maps and spawns. I also have the original DEFCON 5 data with the original 5 defenders and 5 controllers data as well, although the foes there were standard 54x8 content. But that is also part of the variability that I'm sifting through to find a signal within the noise. That signal, if it exists, is the difference between the ATs. Oh, and we'd love to have you jump in on a run. I have Storm Summoning on deck next, so I'll be interested to see how that chaos engine fares against the 801 surge. We're fast running out of incarnate teammates as each character can only be used on one trial unless the team successfully completes a run (which could end early if we call it quits due to exhaustion at the end of a completed mission... usually a Tier 4). So if you have a qualified body - non-support, level 50, IOd, incarnated - give me a shout either here or over on the FAFO Company discord https://discord.gg/mxqXvKaX -
DEFCON II: AFTERMATH — Do Controllers Still Outscale Defenders?
Dark Current replied to Dark Current's topic in Archetypes
His build definitely needs a human rework. It wasn't optimal, but I don't think you can point specifically at it as the reason for the overall results. The cone controls / attacks didn't have the stopping power necessary to hold off these 801s once you start having all the +4 bosses and EBs. After those fail, Empathy doesn't have anything else to rely on to stop the enemy. Meanwhile, the defender has an entire suite of blast attacks with debuffs and soft controls, plus the ATO procs to keep the enemy back and keep the team moving forward. It was my first time with Symphony, so there are definitely areas for improvement. -
DEFCON II: AFTERMATH — Do Controllers Still Outscale Defenders?
Dark Current replied to Dark Current's topic in Archetypes
After streaming Trinculo's 801 Trials on my Twitch channel, I crunched the numbers collected using Sythlin's DPS Tool and analyzed the stats with Excel. The full unedited Trial footage downloaded from Twitch is here: Here's my reaction to that video and report of the results: -
DEFCON II: AFTERMATH — Do Controllers Still Outscale Defenders?
Dark Current replied to Dark Current's topic in Archetypes
Trinculo, the walking Negative Zone! Elec / Rad / Mu Controller build. Mids Build: Trinculo - Controller (Electric Control - Radiation Emission).mbd Build and Solo Test Video: -
DEFCON II: AFTERMATH — Do Controllers Still Outscale Defenders?
Dark Current replied to Dark Current's topic in Archetypes
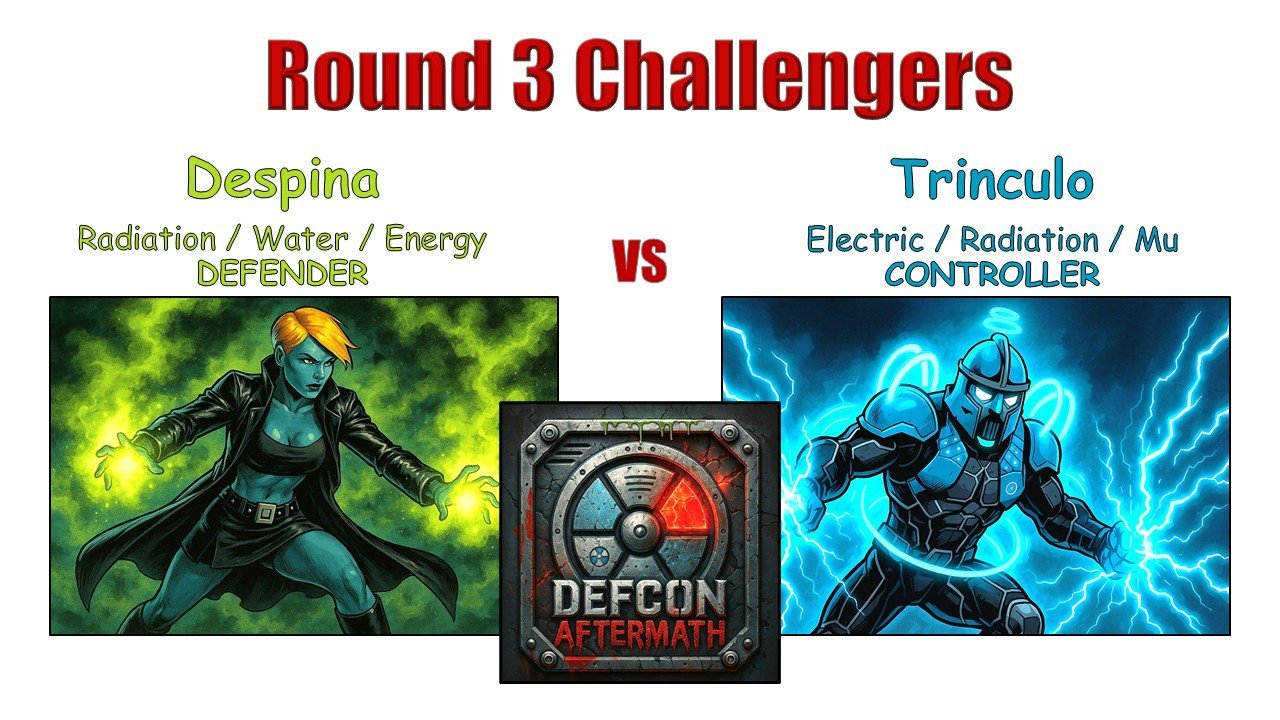
Put on your SPF 1 Million! It's time for the next DEFCON: Aftermath match up!
-
DEFCON 5: Defender vs Controller - Which is the Better Support AT?
Dark Current replied to Dark Current's topic in Archetypes
The Marquis is back with some of the Best of the Worst taking a Slow Walk through a 2-Star Aeon SF. Want to see if he's still an upper echelon DEFCON Supporter? Check out the video "Dr. Aeon Strikeforce - City of Heroes HC" https://www.twitch.tv/videos/2575751944 -
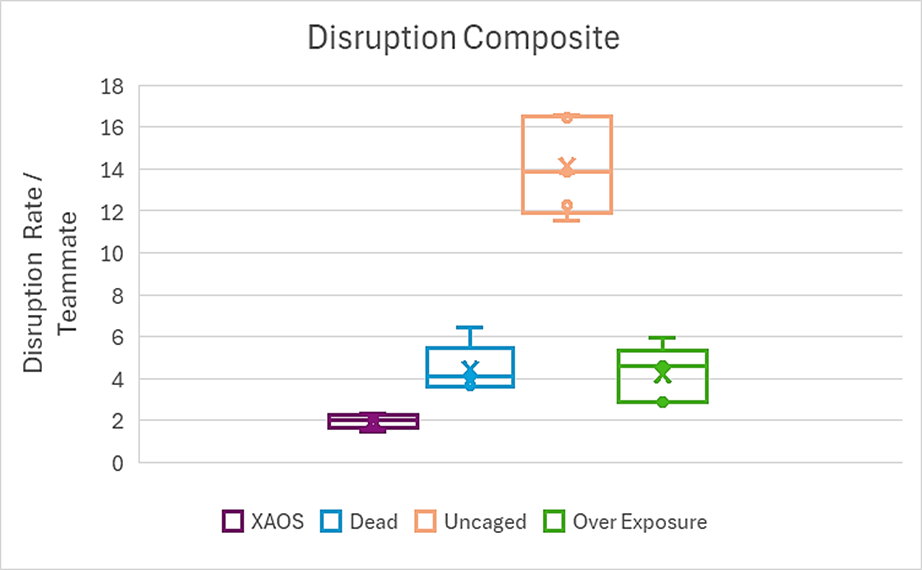
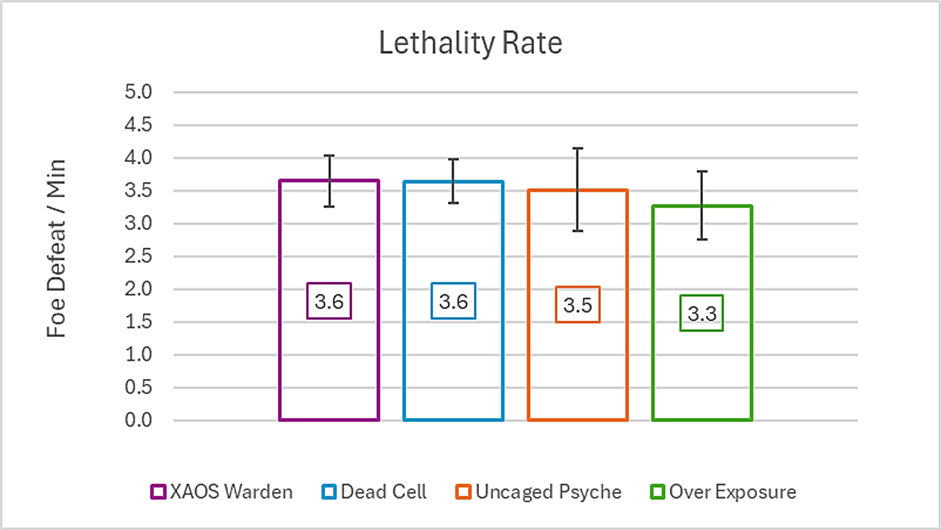
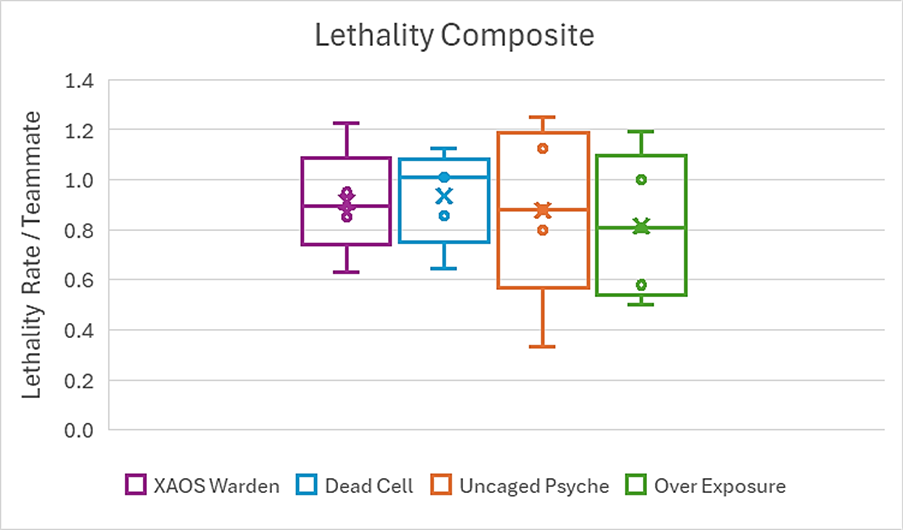
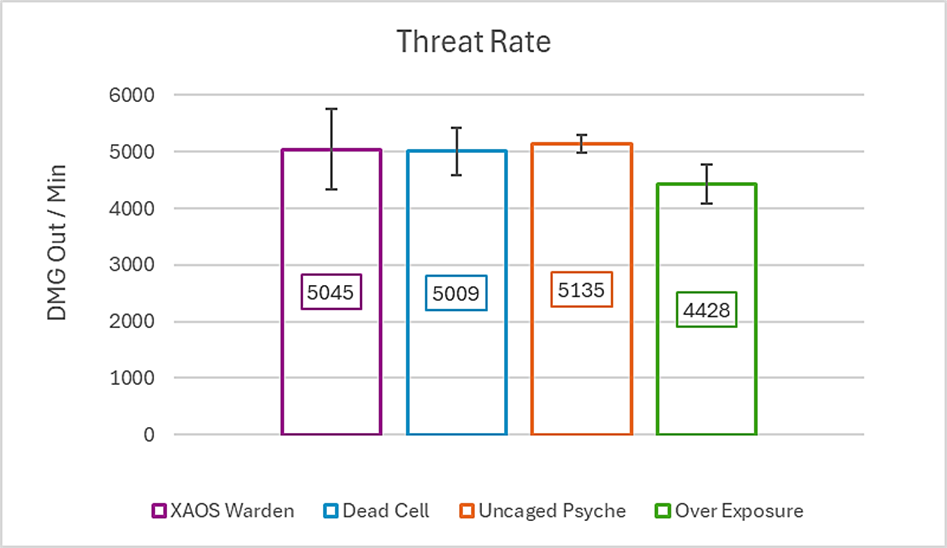
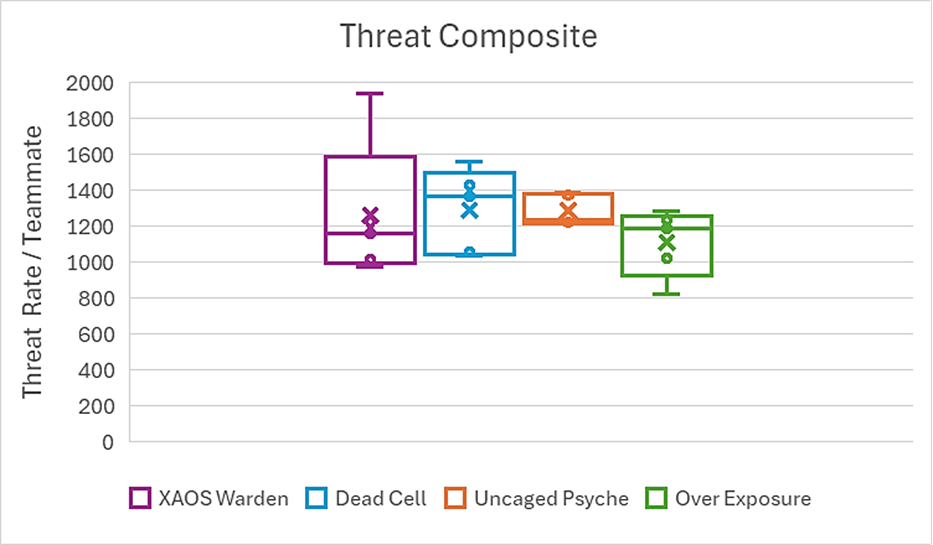
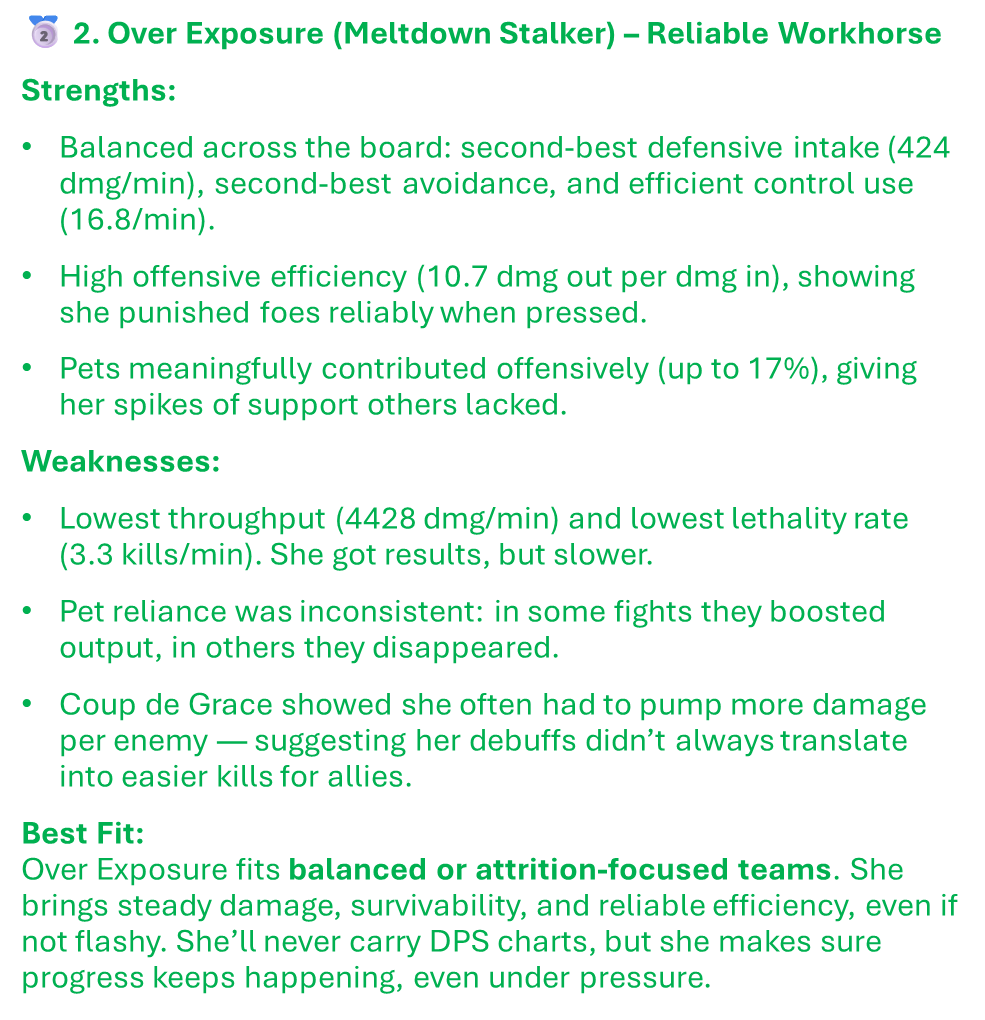
My deep-dive analysis of Strats and Stats from Over Exposure's team trials is up on YT. Check it out to see how the 'Meltdown' Stalker build fared against her 3 predecessors' builds. Key Takeaways: Incoming Damage metrics... Outgoing Controls metrics... Enemy Takedown metrics... Outgoing Damage metrics... Cathy's Rankings...
-
Let us know how your build turns out. I'm curious to see if a 'heal' stalker works.
-
https://discord.gg/VJtUzF7BCP Try that one, @LPMc
-
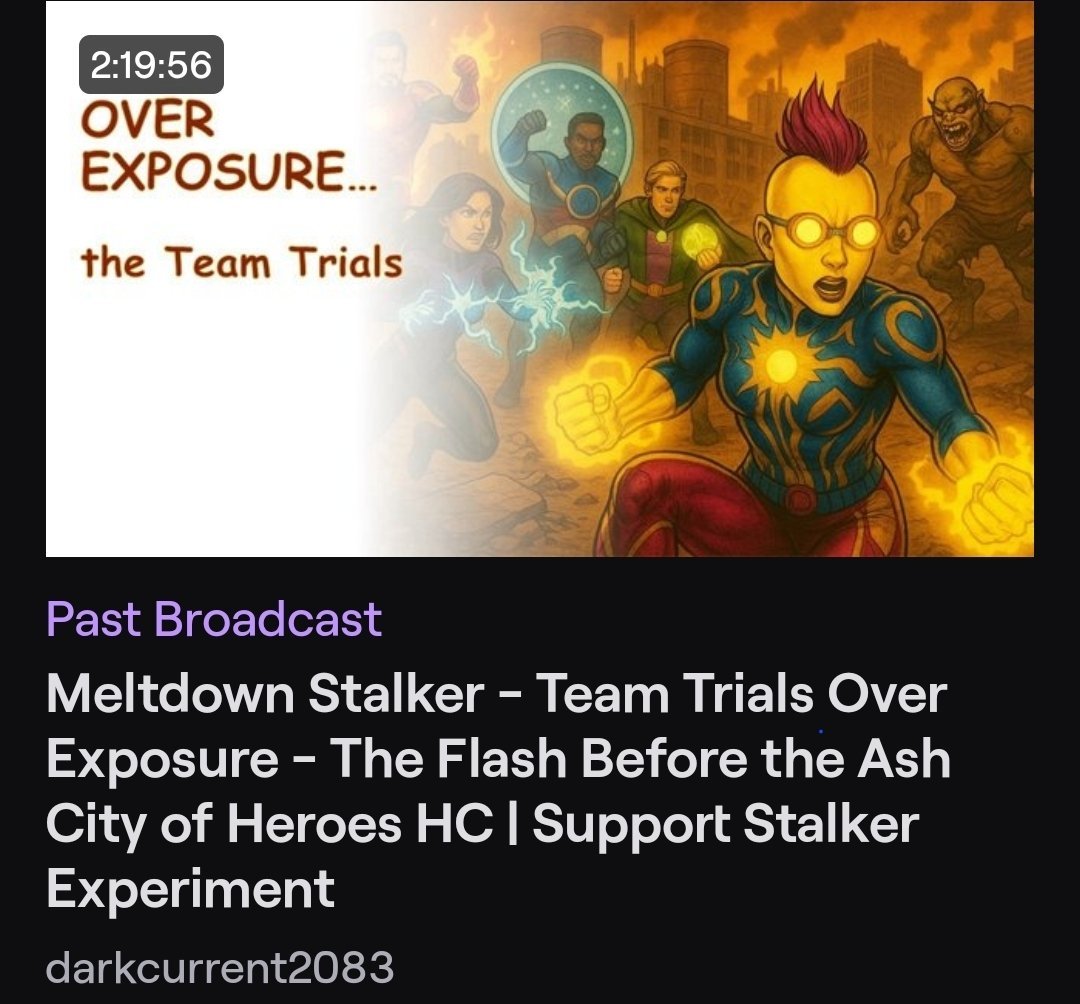
And I ran the Team Trials to record stats for comparison with my other Support Stalkers the other day: Check out this video "Meltdown Stalker - Team Trials Over Exposure - The Flash Before the Ash City of Heroes HC | Support Stalker Experiment" https://www.twitch.tv/darkcurrent2083/v/2564149506?sr=a